
Key Takeaways Bitcoin had just 6,417 daily transactions over $100,000 in the past week. A notable deterioration in current conditions. […]
The post Bitcoin at $71,000: The Data Behind Points in Two Directions appeared first on Coindoo.
Key Takeaways
- Bitcoin had just 6,417 daily transactions over $100,000 in the past week.
- A notable deterioration in current conditions.
- BTC might gain 414% gain following the Silver.
- Bitcoin is trading at $71,203, losing 4% on weekly basis.
Bitcoin whale activity has dropped to its lowest level in years. Large holders are not selling. They are not buying either. They are waiting, and the on-chain data shows exactly how unusual that stillness has become.
What makes the current moment worth examining is not the price level alone. It is the combination of a market in a holding pattern, a supply-demand deterioration flagged by an analyst who saw it coming a month ago, and a cross-asset signal that has preceded every major Bitcoin rally on record. All three are present at the same time and they are not pointing in the same direction.


Whales Have Gone Quiet
According to Santiment data, Bitcoin recorded only 6,417 daily transactions over $100,000 in the past week, the lowest reading since September 2023. Transactions over $1 million came in at 1,485 per day, the lowest since October 2024. Both figures represent a significant pullback from the activity levels seen throughout the 2025 bull run.
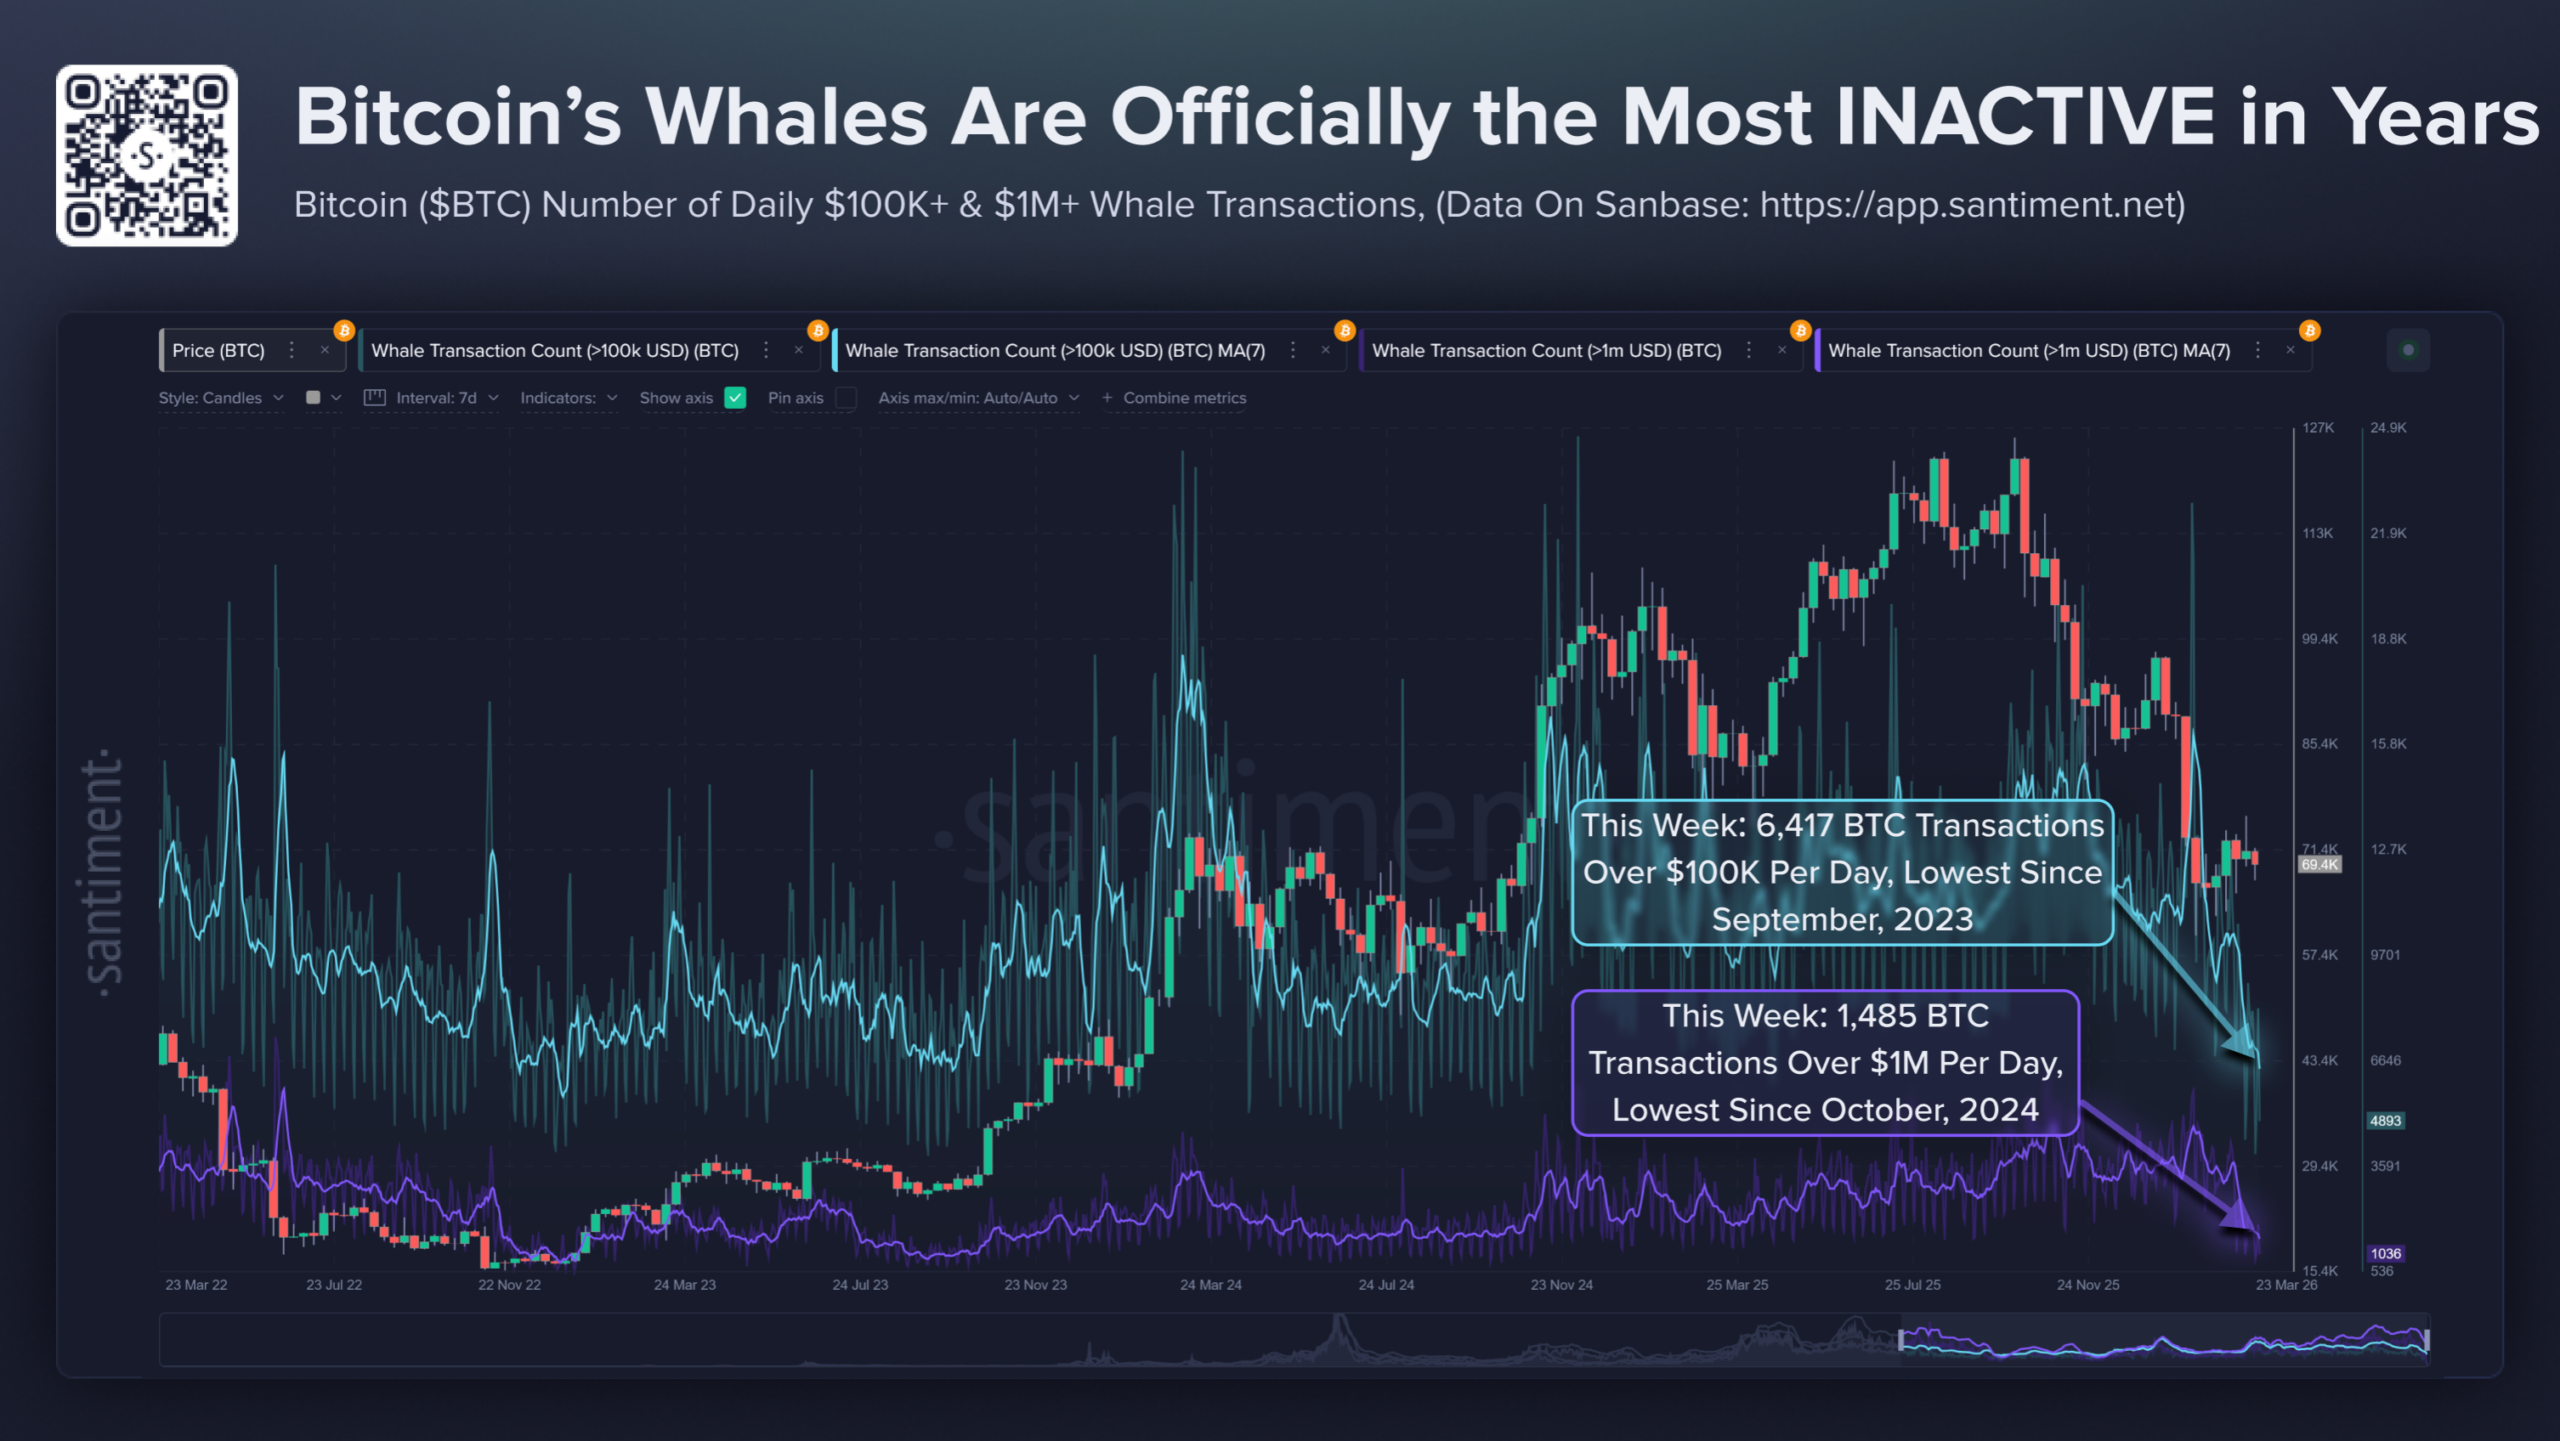
Santiment is direct about what this means and what it does not. Low whale activity is not a bullish or bearish signal on its own. What it signals is that smart money is in the same position as retail holders right now. Policy uncertainty around the CLARITY Act and unresolved global macro conditions have made large capital reluctant to commit in either direction. The market is not being led. It is idling.
A market where large holders are inactive is a market where the next significant move is more likely to come from an external trigger than from organic accumulation or distribution. That is the condition Bitcoin is currently in.
That institutional caution is visible beyond on-chain data. Bitcoin ETF flows turned negative on March 24, recording total net outflows of $66.6 million. Fidelity’s FBTC led the selling with $45.3 million in redemptions, followed by Bitwise’s BITB at $16.6 million and BlackRock’s IBIT at $4.7 million. Other issuers were largely flat. Whales are not moving on-chain. Institutional products are seeing redemptions off-chain. The same hesitation is showing up across both channels.
The Supply-Demand Warning
What the ETF data reflects on the surface, the supply-demand data confirms underneath. An analysis, shared by CryptoQuant, tracking Bitcoin’s supply-demand imbalance since mid-March flagged a notable deterioration in current conditions. The imbalance has worsened and the pace of that worsening has accelerated. More specifically, the current setup does not resemble the gradual recovery patterns seen after prior shocks. It resembles the pattern seen when Bitcoin was trading between $80,000 and $90,000, a period that preceded further downside.
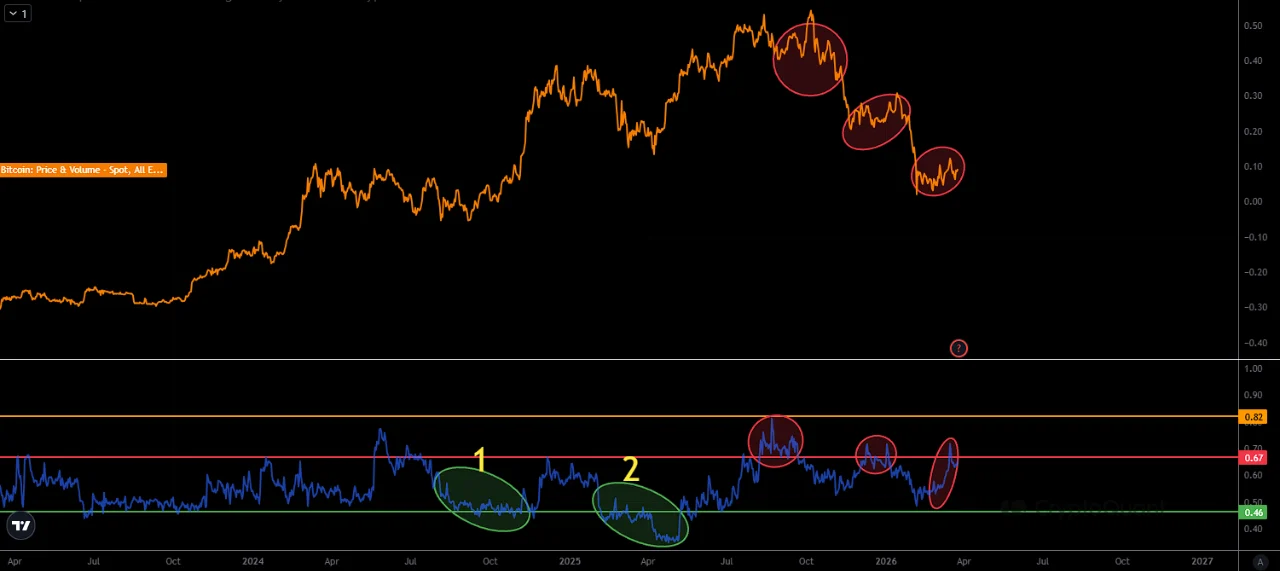
The analyst acknowledges that conditions for a potential bottom are forming. Several data points support that. But the liquidity required to drive an actual trend reversal is not yet present. Short-term price rebounds may generate optimism. The analyst’s assessment is clear: those rebounds are more likely to be bull traps than genuine reversals until liquidity conditions change.
This is not a call for significant further downside. It is a warning against reading short-term strength as confirmation of something larger.

The Silver Signal
Against that cautious backdrop, analyst Merlijn The Trader posted a cross-asset framework that reaches a different conclusion. The argument is built around silver’s price cycle and its historical relationship with Bitcoin.
In 2016, silver peaked. Bitcoin gained 2,309% in the period that followed. In 2020, silver peaked again. Bitcoin followed with a 482% move. Silver has now reached an all-time high in 2026. Based on the same pattern, Merlijn projects a 414% gain for Bitcoin. Three instances. Zero exceptions.
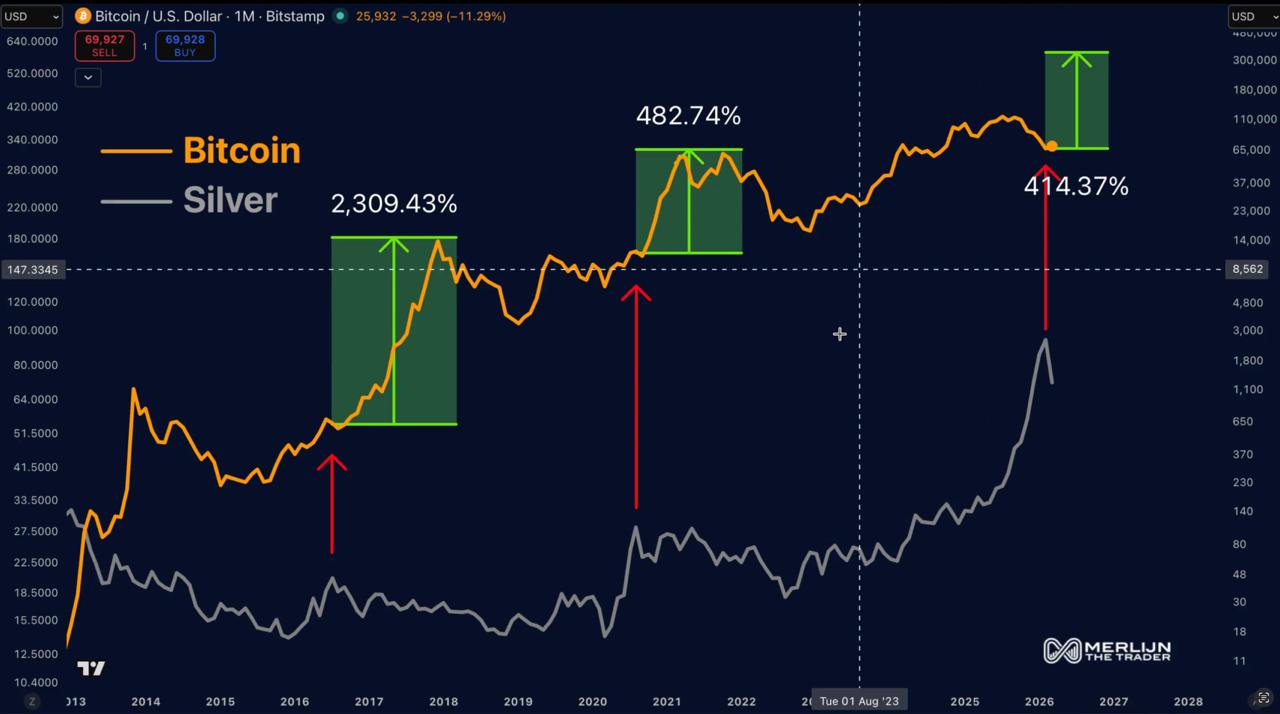
The confirmation level is $70,000. If it holds above it the signal will be active. Lose it and the pattern needs more time. Bitcoin is currently trading above that level.
The tension between this signal and the supply-demand warning is the real story the data is telling. A macro cross-asset signal can be valid while short-term liquidity conditions remain unfavorable. One speaks to where the market is heading over a longer horizon. The other speaks to what happens before it gets there. Both can be right.
Price Action
Bitcoin is trading at $71,203 on the four-hour chart at the time of writing. Reading the chart from left to right, price dropped from around $74,000 in mid-March through a series of lower sessions, reaching a low near $67,000 on March 23. A recovery followed, pushing price back above $71,500 before settling at current levels. The 50-period moving average on the four-hour sits at $70,730 and BTC is currently trading just above it.
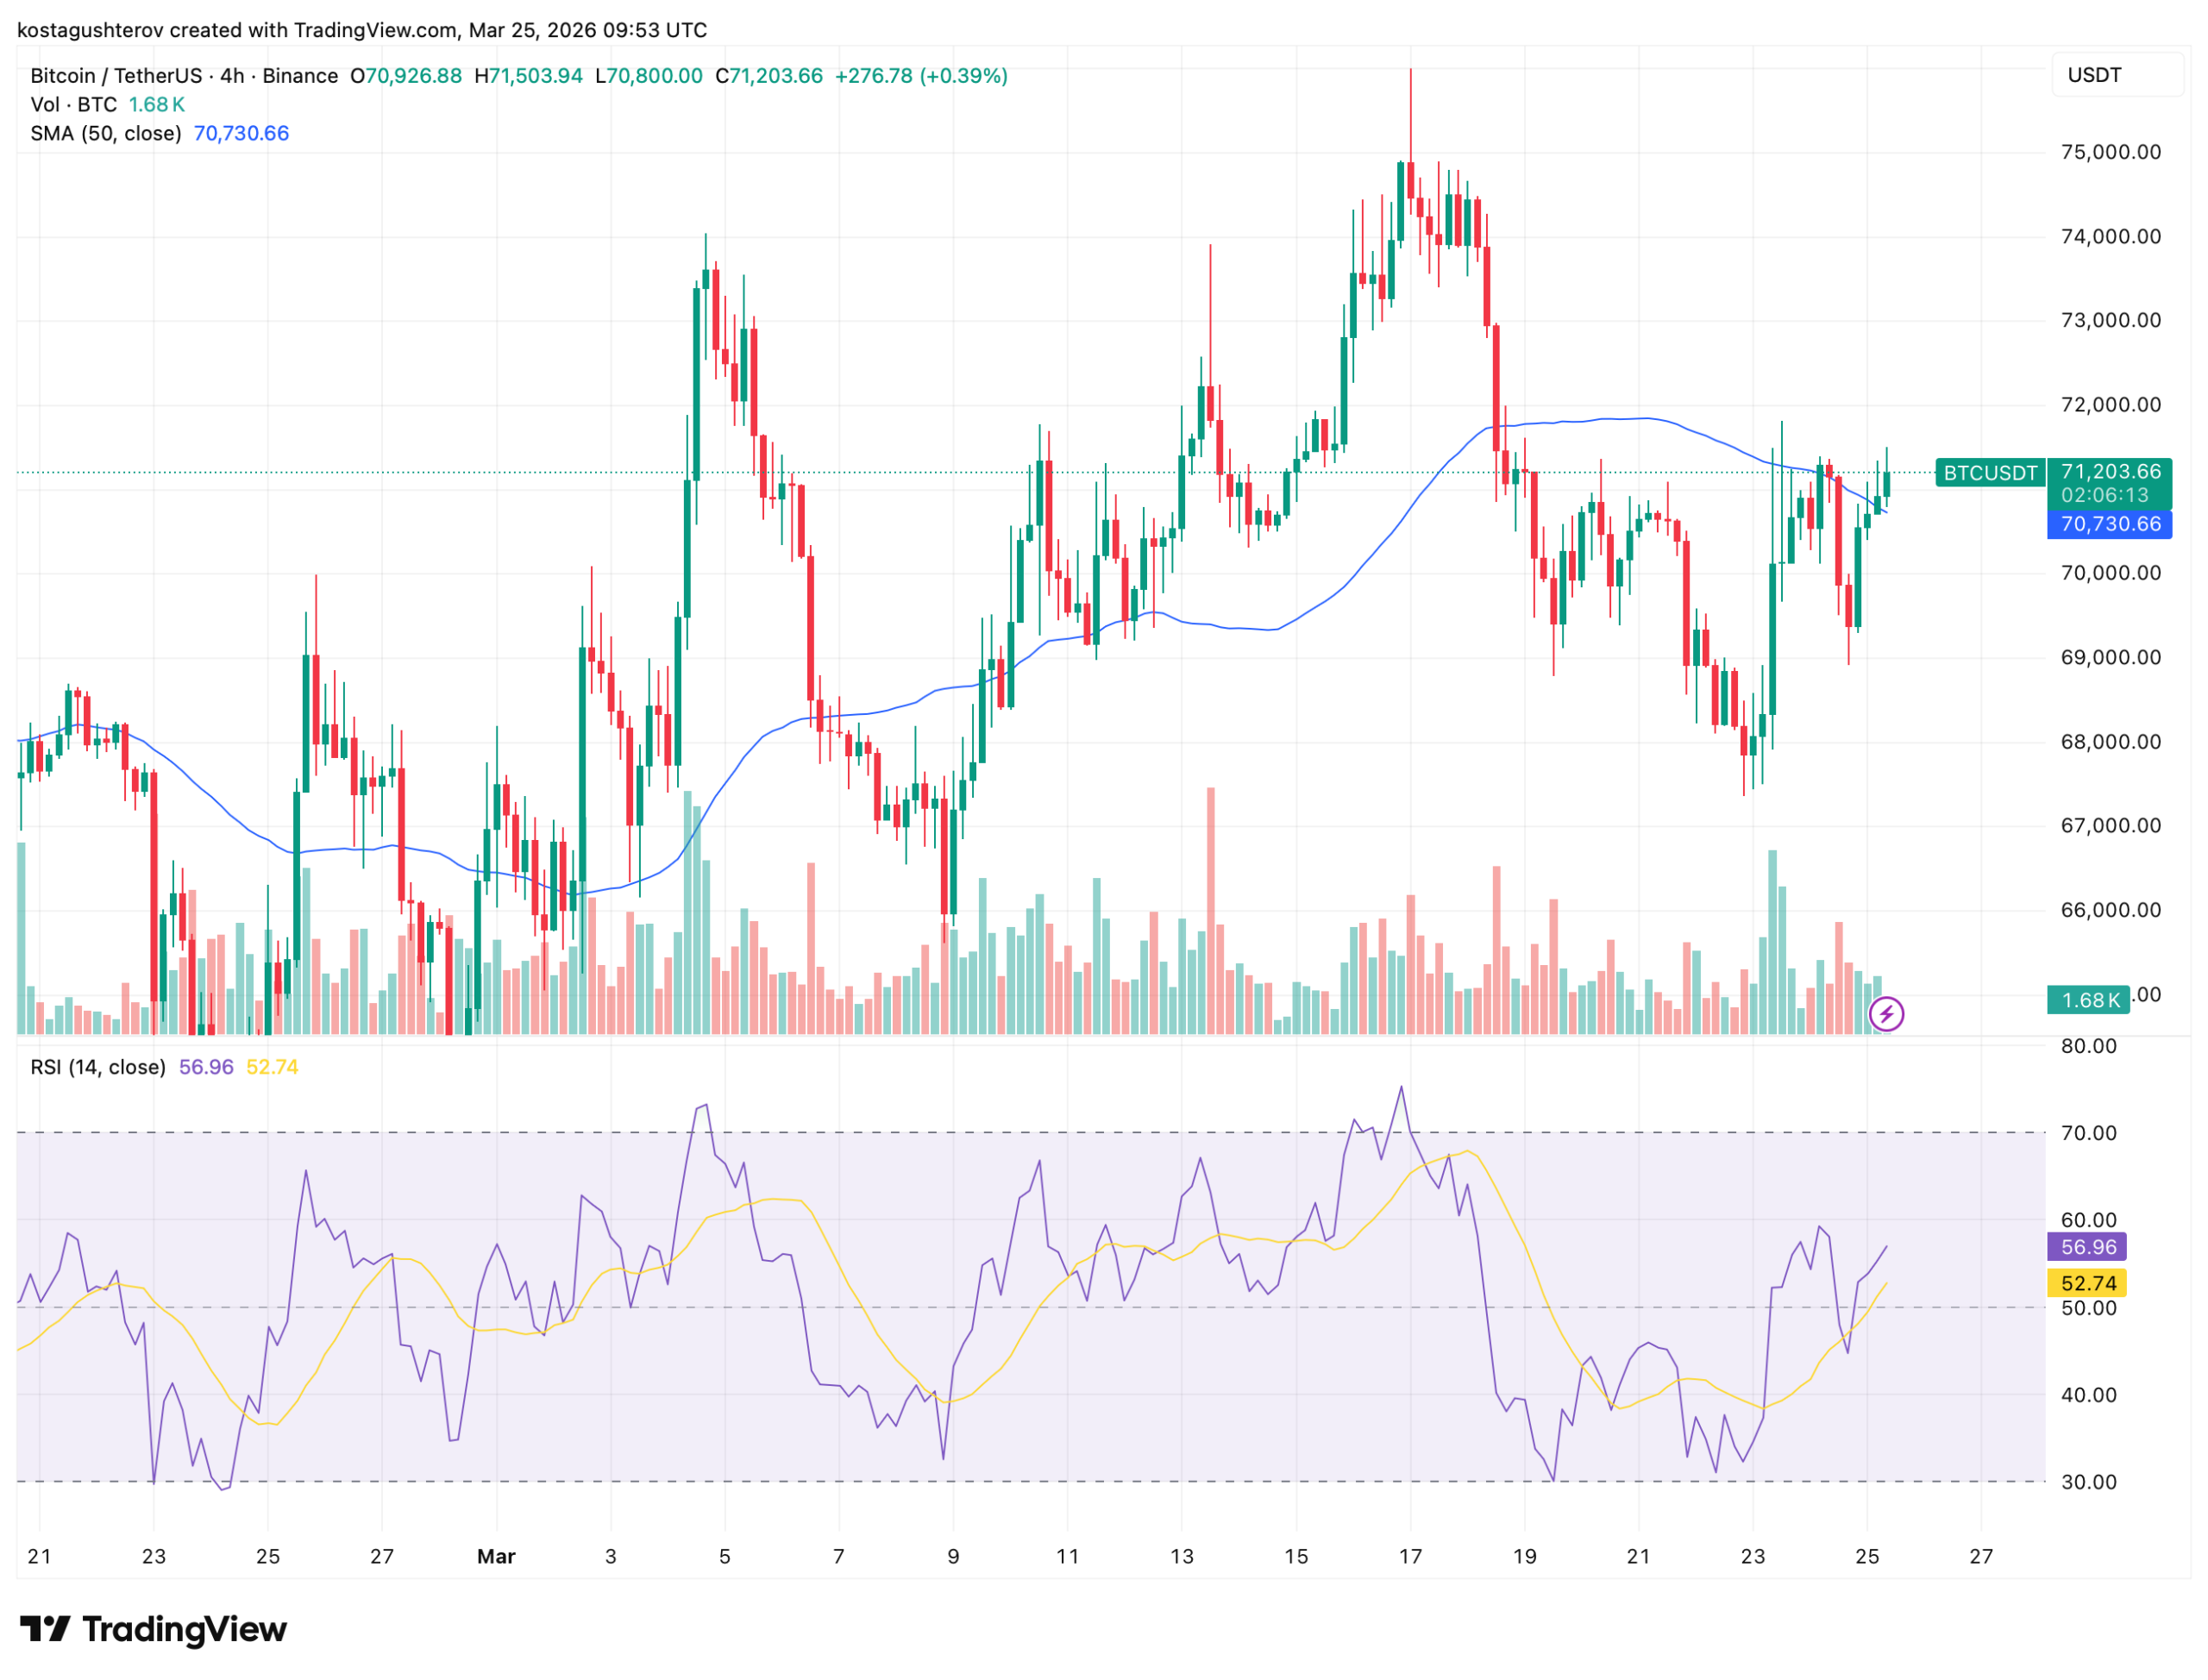
The RSI is at 56.96, above its smoothed average of 52.74. Buying momentum has crossed above the signal line on the four-hour timeframe. The supply-demand analyst warns that short-term rebounds may not hold. The silver signal says the macro setup is already in place. The price sitting just above $70,000 is where both of those views get tested.
Two Signals, One Price Level
Its clear that the data is mixed.
The supply-demand warning says the conditions for a reversal are forming but the reason which is going to drive it is not here yet. The silver signal says the macro setup that preceded every major Bitcoin rally in history is active right now. Whale inactivity says large capital is not committing until something external forces the decision.
These three readings together describe a market that is set up for a significant move but has not yet received the trigger to make it. Whether that trigger arrives as improving liquidity, a CLARITY Act resolution, or a broader macro shift is the question none of the current data answers. What it does confirm is that $70,000 is not just a technical level. It is the line where the bullish case either gets confirmed or gets delayed.
The information provided in this article is for educational purposes only and does not constitute financial, investment, or trading advice. Coindoo.com does not endorse or recommend any specific investment strategy or cryptocurrency. Always conduct your own research and consult with a licensed financial advisor before making any investment decisions.
The post Bitcoin at $71,000: The Data Behind Points in Two Directions appeared first on Coindoo.
Source: https://coindoo.com/bitcoin-at-71000-the-data-behind-points-in-two-directions/
More Crypto News
Check our Market Overview
Disclaimer: This article is for informational purposes only and does not constitute financial advice. Always conduct your own research (DYOR).


