
Key Takeaways Two CryptoQuant on-chain signals are flashing capitulation at the same time. Long-term holders are now moving coins at […]
The post Two Bitcoin Signals Hit Levels Historically Tied to Bottoms appeared first on Coindoo.
Key Takeaways
- Two CryptoQuant on-chain signals are flashing capitulation at the same time.
- Long-term holders are now moving coins at a loss, a sign of maximum pain.
- The profit/loss ratio of spent coins has dropped to bear-market lows.
- Historically these conditions marked bottoms, but they don’t time them.
Long-Term Holders Are Selling at a Loss
The first signal is the Long-Term Holder SOPR, which measures whether coins held for more than 155 days are being moved at a profit or a loss. When it drops toward or below 1, it means the long-term-held coins that are actually being moved are changing hands at breakeven or a loss. Worth being precise here: this doesn’t mean long-term holders as a whole are selling. The metric only captures coins that move, so most long-term supply may be sitting still, what it shows is that the patient-held coins that do change hands are no longer doing so at a profit.
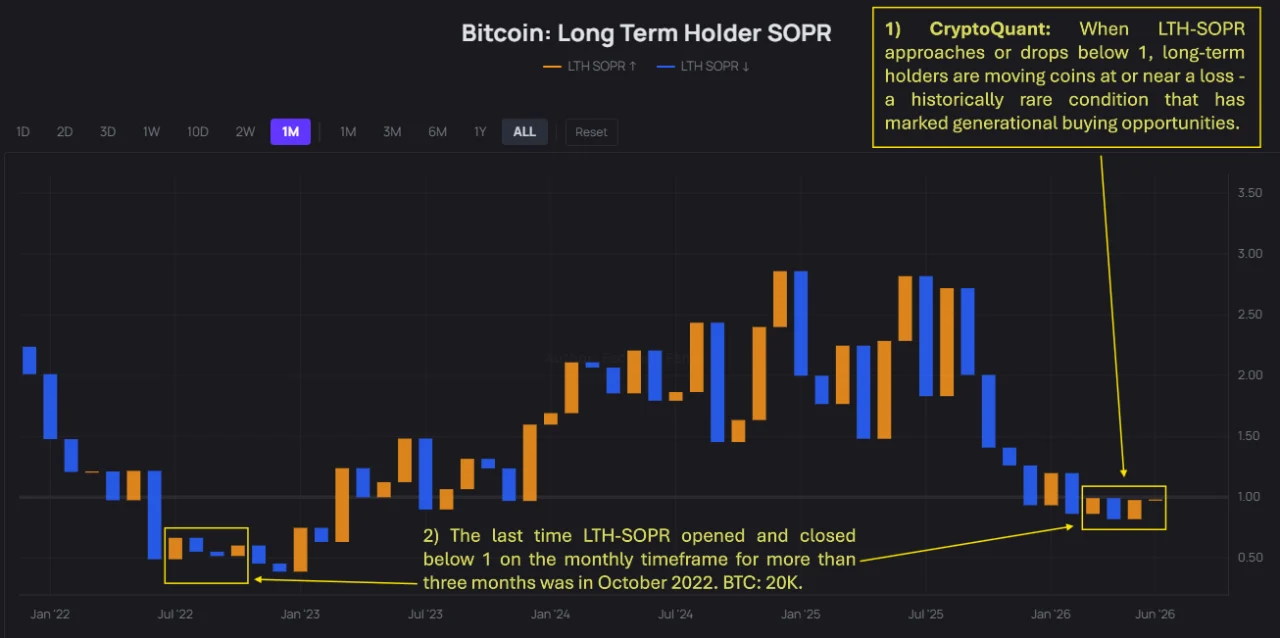
The historical context is what gives it weight. The last time this metric stayed below 1 on the monthly timeframe for more than three months was October 2022, when Bitcoin was near $20K and essentially every cycle-bottom indicator was firing at once. The current monthly chart shows the indicator approaching that same sub-1 zone for the first time since then. As the analysis shared by CryptoQuant frames it, this is a historically rare condition that has marked generational buying opportunities, a conditions signal, not a timing one.


The Profit/Loss Ratio Confirms It
The second signal looks at the same capitulation through a different lens: the UTXO Block Profit/Loss Count Ratio, which tracks how many coins are being spent in profit versus at a loss across all transactions. At cycle peaks, the ratio runs high, almost all spending is profitable. At cycle bottoms, it collapses, because most of the coins being moved are underwater.
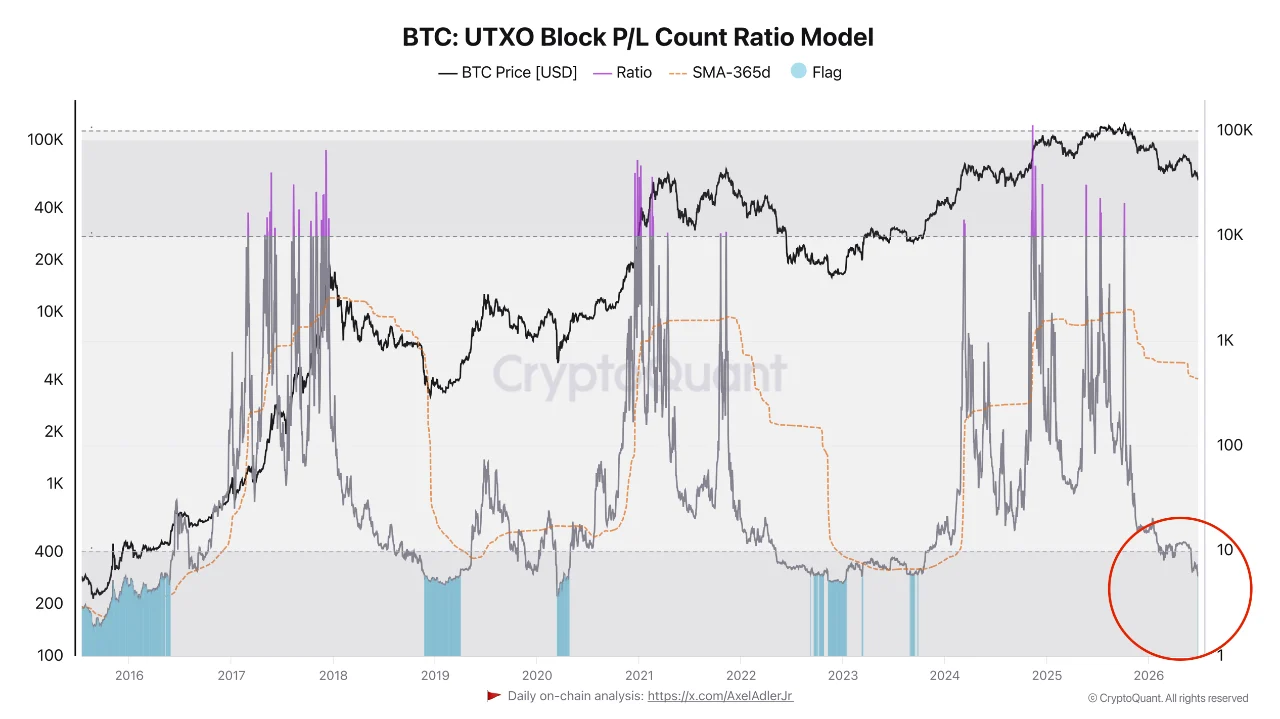
The current reading has dropped to its lowest level since this correction began, triggering a signal that, according to another analysis shared by CryptoQuant, has appeared for the first time this cycle. On the full chart going back to 2016, every prior time this signal fired at these levels coincided with a stretch that proved profitable for long-term investors who held through it. The framing from that analysis is pointed: these moments correspond to when the majority gives up and loses interest, and that, rather than when profits are being realized, is the time to pay closer attention to the market.

What They Mean Together, and What They Don’t
It’s worth being precise about what these two signals do and don’t say. Neither calls a price bottom with any accuracy. What they identify is a behavioral state: maximum loss realization, widespread capitulation, the point where a market starts to exhaust its sellers. That’s different from confirming the low is in.
This also connects to a signal covered earlier this week. A separate indicator, shared by CryptoQuant’s CEO, the 4-Year Realized Price Risk/Reward Ratio, suggested the definitive bottom signal hadn’t fired yet.
Not sure Bitcoin is at the cycle bottom. pic.twitter.com/rhDiIbHkxY
— Ki Young Ju (@ki_young_ju) June 26, 2026
These two signals don’t contradict that, they describe an earlier phase of the same event. The SOPR and UTXO ratios measure capitulation in progress; the Risk/Reward ratio measures when that capitulation is complete. One is the storm, the other is the all-clear, and the all-clear hasn’t sounded.
The balanced takeaway
The historical record across both charts is genuinely consistent: these specific conditions have not persisted indefinitely, and every prior instance eventually resolved with price recovery. That’s a real, notable pattern, not noise. But two cautions keep it grounded. First, “historically resolved with recovery” is a small set of past cycles, not a guarantee about this one, and the duration is entirely uncertain, capitulation can deepen and drag on before it ends. Second, these are conditions signals, they describe where the market is psychologically, not when it turns.
So the accurate framing could be this: the data shows the market is in a state that has, in the past, preceded recoveries, while a separate signal says the final confirmation hasn’t arrived. The direction the historical pattern points is one way; the timing remains the open question. What these indicators reward isn’t a prediction, but attention, the willingness to watch closely at exactly the moment most participants have stopped looking.
The post Two Bitcoin Signals Hit Levels Historically Tied to Bottoms appeared first on Coindoo.
Source: https://coindoo.com/two-bitcoin-signals-hit-levels-historically-tied-to-bottoms/
More Crypto News
Check our Market Overview
Disclaimer: This article is for informational purposes only and does not constitute financial advice. Always conduct your own research (DYOR).


