

The setup remains constructive, but the breakout has not yet been fully confirmed. ETH must hold above the reclaimed level […]
The post Ethereum Eyes $2,000 as ETF Inflows Return appeared first on Coindoo.
The setup remains constructive, but the breakout has not yet been fully confirmed. ETH must hold above the reclaimed level and successfully retest it as support before the move can be treated as a stronger change in market structure.
The $2,000 Area Is the Next Major Test
The chart shows ETH respecting a series of higher lows inside an ascending channel. The latest recovery pushed the price through the 0.382 Fibonacci barrier near $1,870 that had limited the previous advance, keeping the short-term bullish structure intact for now.
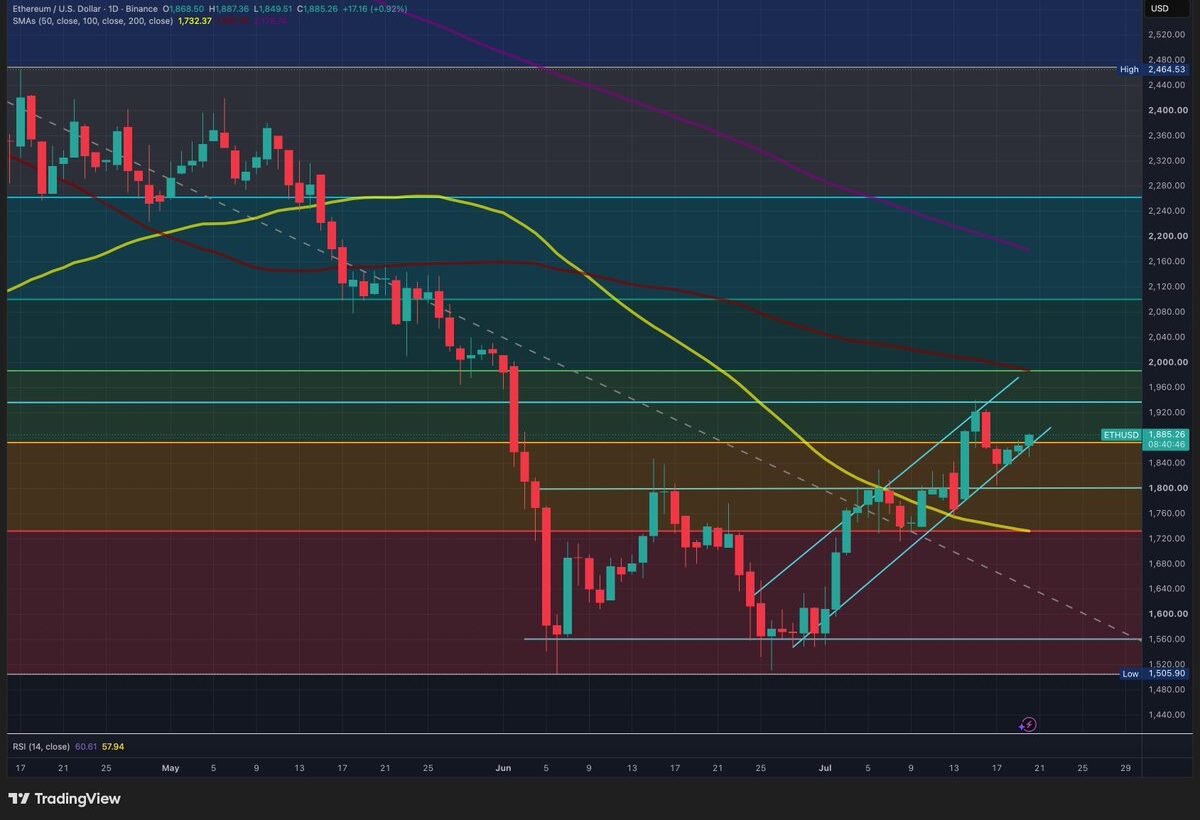
The next major resistance sits close to 0.5 Fib level near $2,000, where the 100-day simple moving average and a horizontal technical level converge. That combination could create stronger selling pressure than the resistance Ethereum has just challenged.


A sustained move above the current Fibonacci level would leave the upper part of the rising channel and the $2,000 region as the next targets. A breakout followed by a successful retest would provide stronger confirmation that buyers are maintaining control rather than producing another brief move above resistance.
The bullish interpretation would weaken if ETH falls below the lower boundary of the channel. In that scenario, the horizontal area around $1,800 would become the next visible support to monitor. Losing both the channel and that level would return the price to the wider consolidation range below.
ETF Flows Turn Positive After Eight Red Weeks
The technical recovery is developing alongside an improvement in Ethereum spot ETF flows. The funds recorded $84.42 million in net inflows during the week ending July 10, followed by another $105.44 million in the week ending July 17, per SoSoValue data.
That represents two consecutive positive weeks and approximately $189.86 million in combined inflows after eight straight weeks in the red.
The reversal does not yet establish a long-term institutional accumulation trend, but it removes one source of persistent selling pressure that had accompanied Ethereum’s earlier decline. A third positive week would make the change in direction more convincing, particularly if ETH continues advancing toward the 100-day moving average.

Validator Exit Wait Falls to Zero
Ethereum’s validator queue shows an even sharper imbalance according to Validatorqueue data. The exit waiting time reached effectively zero days, with only 32 ETH shown in the exit queue and an estimated wait of approximately one minute.
At the same time, the entry queue contained roughly 2.47 million ETH, producing an estimated waiting period of 42 days and 19 hours. The one-year queue chart shows entry delays remaining above 40 days while the exit wait returned to zero around July 19.
This suggests that substantially more ETH is waiting to enter the validator set than leave it. However, a zero-day exit queue does not mean withdrawn ETH becomes available immediately. The data also showed a separate sweep delay of approximately 7.7 days before exited funds could be processed fully.
The queue imbalance supports the view that demand for Ethereum staking remains strong, but it should not be treated as a direct price signal. Validator deposits can reflect long-term yield strategies and institutional staking operations rather than immediate spot-market buying.
The Bullish Structure Still Needs Confirmation
Ethereum currently has three supportive developments working together: a rising technical structure, two consecutive weeks of ETF inflows and almost no validator exit backlog.
The decisive test remains near $2,000. Holding above the recently reclaimed Fibonacci level near $1,870 and the rising channel would keep that resistance in play. A rejection followed by a break below the channel would shift attention back toward $1,800 and show that the latest breakout attempt lacked enough demand to continue.
For now, the structure remains bullish, but the market still needs to confirm that the move above resistance can survive a retest.
This article is provided for informational purposes only and does not constitute financial or investment advice.
The post Ethereum Eyes $2,000 as ETF Inflows Return appeared first on Coindoo.
Source: https://coindoo.com/ethereum-etf-inflows-return/


More Crypto News
Check our Market Overview
Disclaimer: This article is for informational purposes only and does not constitute financial advice. Always conduct your own research (DYOR).