

Key Takeaways HYPE is testing support where the 0.5 Fibonacci level aligns with the 100-day moving average. HYPE spot ETFs […]
The post HYPE Tests Crucial Support as ETF Demand Weakens appeared first on Coindoo.
Key Takeaways
- HYPE is testing support where the 0.5 Fibonacci level aligns with the 100-day moving average.
- HYPE spot ETFs recorded approximately $14.7 million in net outflows across the latest 11 trading sessions.
- A large holder staked 2.93 million HYPE worth about $172 million.
HYPE is trading near $58.7 at the time of writing after falling from above $70 earlier in July. Price is now close to the 0.5 Fibonacci retracement and the rising 100-day simple moving average near $56.65.
The overlap creates a clear area for the market to defend, but the surrounding data is mixed.
The First Recovery Test Sits Near $62.50
If HYPE holds above the current support area, the first important resistance sits around $62.50 at the 0.382 Fibonacci retracement.


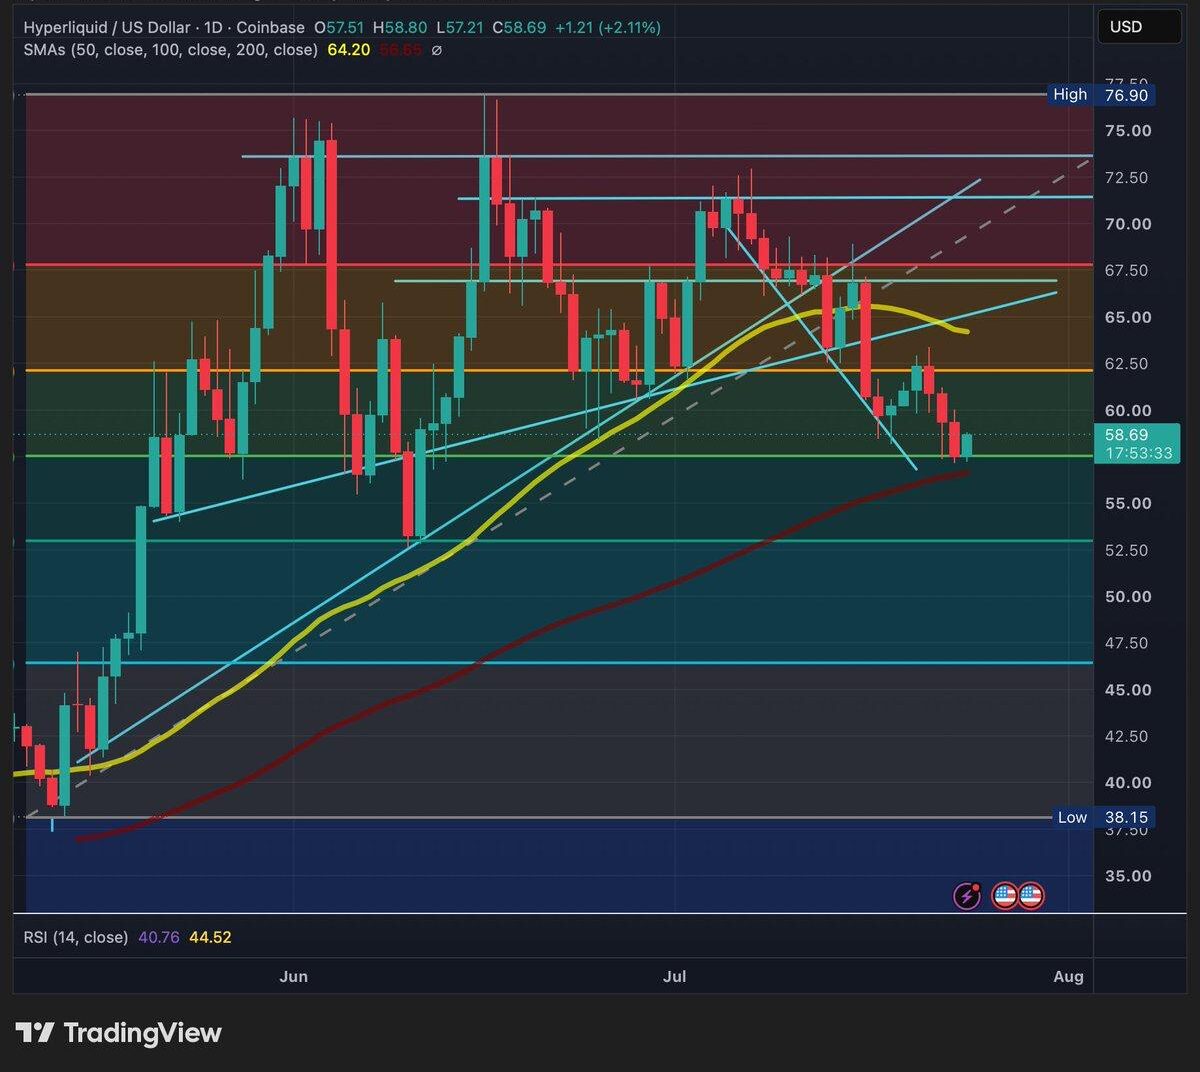
That level previously acted as support and may now attract selling pressure. Above it, the 50-day simple moving average near $64.20 would provide another obstacle before price could challenge the higher resistance zones visible on the chart.
Daily RSI is near 41, reflecting weak momentum without showing deeply oversold conditions. The indicator leaves room for a rebound, but price would still need to recover the nearby resistance levels before the structure materially improves.
A decisive loss of the 100-day average would shift attention toward the 0.618 Fibonacci retracement near $53. That area represents the next major support within the wider advance from the May lows.
ETF Demand Has Faded
According to SoSoValue data, HYPE spot ETFs recorded approximately $14.7 million in combined net outflows across the latest 11 trading sessions.
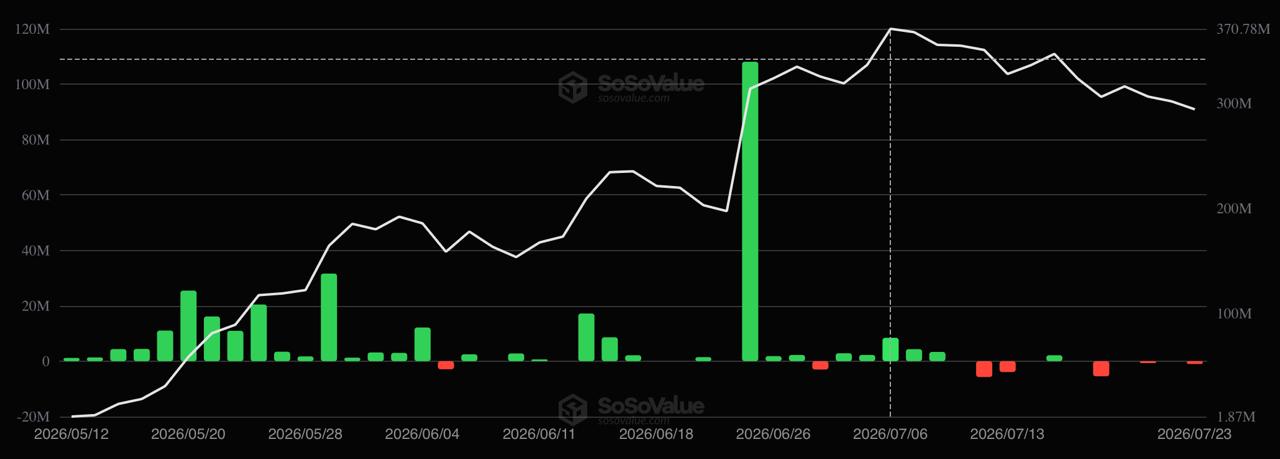
The recent weakness marks a change from the earlier flow picture. HYPE had previously attracted interest around Hyperliquid’s fee-funded token buybacks and growing derivatives activity, factors examined in our analysis of whether HYPE could become a smart-money play in the next market cycle. The latest redemptions do not invalidate that longer-term thesis, but they show that ETF demand is no longer providing the same near-term support.
Only July 15 produced a positive result, with $2.13 million entering the funds. The largest redemptions included $5.73 million on July 10, $3.93 million on July 13 and $5.45 million on July 17.
Five sessions recorded no net movement, while the latest available day showed another $1.02 million leaving the products.
The pattern suggests that ETF investors are not currently providing sustained demand. Flat sessions are less negative than continued redemptions, but a clearer improvement would require several consecutive inflow days rather than one isolated positive result.

A Whale Stakes $172 Million in HYPE
Large-holder activity is sending a different signal.
Per Lookonchain data, 19 wallets believed to belong to the same entity deposited and staked 2.93 million HYPE during a 24-hour period. The position was worth approximately $172 million at the time of the transfer.
A whale staked 2.93M $HYPE ($172M)!
Over the past 24 hours, 19 wallets (likely belonging to the same whale) deposited 2.93M $HYPE ($172M) into Hyperliquid and staked it.
The 2.93M $HYPE was accumulated 9 months ago at an average price of $44 and is now up ~$44.5M.… pic.twitter.com/azQLeg1vmO
— Lookonchain (@lookonchain) July 24, 2026
The tokens were reportedly accumulated nine months earlier at an average price near $44. At the current valuation, the holder was sitting on an unrealized gain of roughly $44.5 million.
Choosing to stake rather than sell may indicate that the holder intends to maintain exposure despite the profit. Staked tokens are also less immediately available for sale, although activity from one entity cannot establish how the wider holder base is positioned.
Price Must Resolve the Conflicting Signals
The ETF data points to weak external demand, while the whale transaction suggests that at least one major holder remains willing to lock up a substantial position.
Neither signal settles the technical question on its own. The market still needs to show whether the current support can attract enough demand to stop the decline.
A move above $62.50 would offer the first evidence that the recovery is gaining traction. A break below the 100-day average would instead weaken the structure and make the lower Fibonacci support increasingly relevant.
The information provided in this article is for educational purposes only and does not constitute financial, investment, or trading advice.
The post HYPE Tests Crucial Support as ETF Demand Weakens appeared first on Coindoo.
Source: https://coindoo.com/hype-tests-crucial-support-etf-demand-weakens/


More Crypto News
Check our Market Overview
Disclaimer: This article is for informational purposes only and does not constitute financial advice. Always conduct your own research (DYOR).