
The move has shifted the chart’s focus from upside targets to the supports that could contain the pullback. The rally […]
The post Solana Price Loses Key Support: Is $100 Next? appeared first on Coindoo.
The move has shifted the chart’s focus from upside targets to the supports that could contain the pullback.
The rally lost its floor around $109
Since early August, SOL had moved inside a rising parallel channel, with each pullback holding above the prior low. The latest sell-off broke that pattern by pushing price beneath the channel’s lower boundary and through the $109.2-$109.7 range, where the former channel floor met the 50-day simple moving average and the 23.6% Fibonacci retracement.
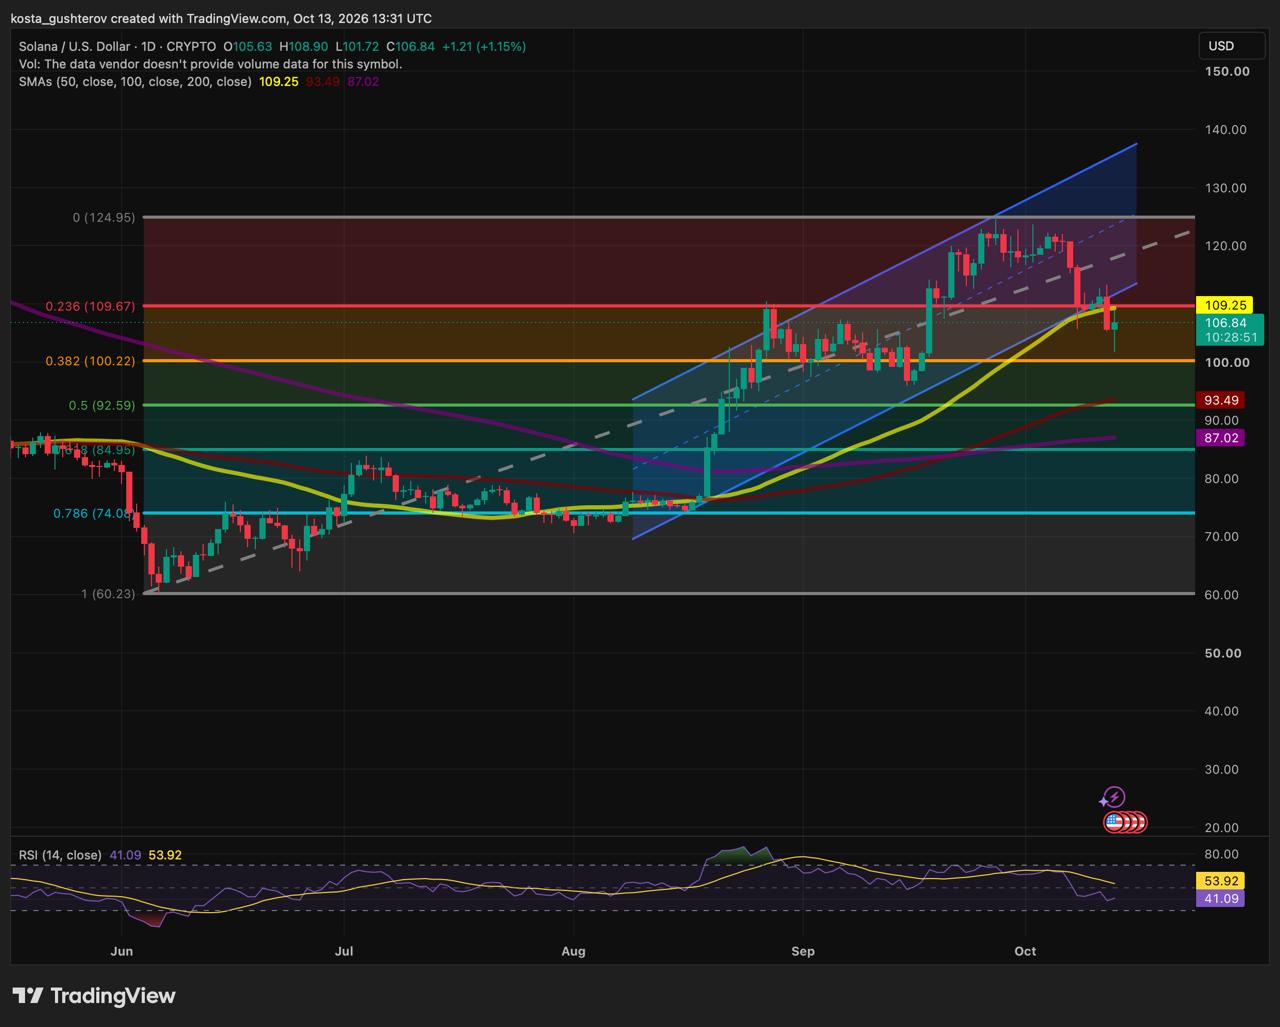
That range had helped contain earlier September pullbacks. With SOL now below it, the same combination of chart references sits overhead. A recovery above $109.2-$109.7 would place price back inside the channel and above its 50-day average; while it remains below, rebounds may meet resistance there.


With $109 overhead, attention has moved to $100
The latest daily session reached an intraday low of $101.72, stopping just above the 38.2% Fibonacci retracement at $100.2. The round $100 mark falls in the same range, making it the first area where buyers have attempted to slow the decline.
The response should be judged around $100 rather than at one exact number. A short move below the range would not settle the chart by itself. Persistent daily trading beneath it, however, could leave SOL searching for support closer to the longer-term moving averages.
Lower supports become relevant only if $100 fails
If SOL cannot stabilise around its current support, the next reference lies between $92.5 and $93.5. The 50% Fibonacci retracement sits near $92.5, while the rising 100-day SMA is near $93.5. Their overlap makes this the next important range beneath the market.
Further down, the 61.8% Fibonacci retracement near $85 overlaps with the 200-day SMA near $87. That area would become the chart’s deeper support reference only if SOL also trades through the 100-day average.
Momentum has weakened with the price structure
Losing the 50-day SMA has damaged SOL’s short-term trend. The 100-day and 200-day averages are still rising below price, though, leaving support layers from the August advance intact at lower levels.
The same loss of momentum is visible in daily RSI, which has fallen to around 41—below its 50 midpoint and its signal line near 54.

RSI confirms the slowdown that followed SOL’s retreat from the recent high near $125. A recovery in the indicator would carry more weight if price also regains the former $109 support cluster.
The rebound has a clear repair point
Solana’s chart has shifted from an orderly channel advance to a correction below its first major support cluster. Holding around $100 could keep the pullback contained, but the short-term structure would remain fragile until SOL returns above the former channel floor near $109.
If the current support cannot hold, the $92.5-$93.5 area would become the next technical test. The rising 100-day and 200-day averages leave room for a deeper correction without erasing the entire August advance, yet the immediate trend remains weaker while SOL trades below the lost channel.
This article is provided for informational purposes only and does not constitute financial or investment advice. Technical levels and indicators are interpretive tools, not guarantees of future price movement.
The post Solana Price Loses Key Support: Is $100 Next? appeared first on Coindoo.
Source: https://coindoo.com/solana-price-loses-key-support-is-100-next/


More Crypto News
Check our Market Overview
Disclaimer: This article is for informational purposes only and does not constitute financial advice. Always conduct your own research (DYOR).