

That price range has become more important as recent futures activity eases from an elevated monthly level and exchange-flow data […]
The post XRP Flashes Golden Cross: Will It Break $1.43 Resistance? appeared first on Coindoo.
That price range has become more important as recent futures activity eases from an elevated monthly level and exchange-flow data offers an incomplete view of supply.
A recovery has reached its first resistance
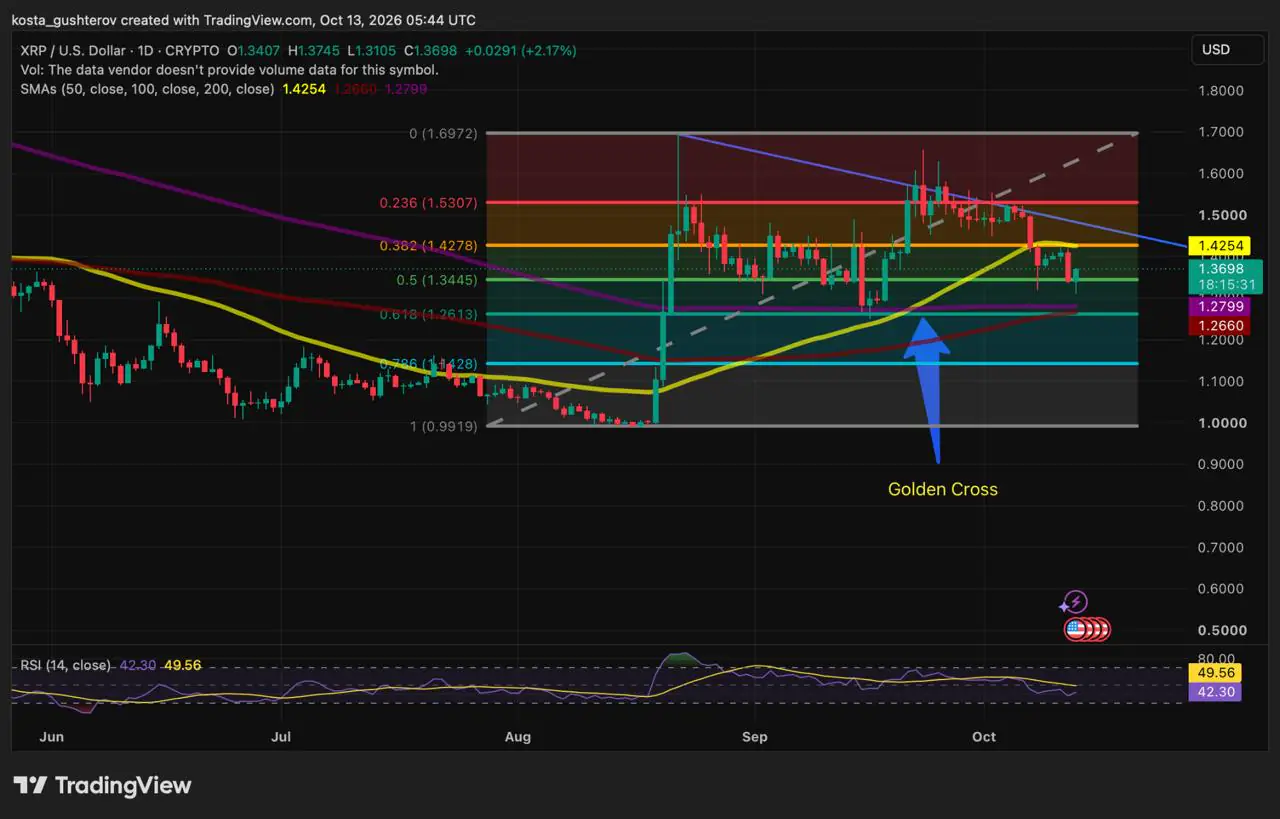
The XRP/USD daily chart showed XRP near $1.37 at the time of writing, placing price above the 50% Fibonacci retracement at $1.34. This level has acted as the immediate anchor during the pullback from the September high near $1.70.
The first resistance range sits at $1.425-$1.428, where the 50-day simple moving average near $1.4254 overlaps with the 38.2% Fibonacci retracement near $1.4278. XRP also remains beneath a descending trendline that passes through the high-$1.40s, creating another chart reference above the moving average.


Daily RSI was near 42.3, below the 50 midpoint and its own moving average. That leaves momentum subdued during the rebound. A sustained recovery through the $1.425-$1.428 range could shift attention toward the 23.6% Fibonacci level near $1.53.
XRP is holding above its first pullback reference while testing a confluence of moving-average and Fibonacci resistance.
Current open interest has fallen below its elevated 30-day average, indicating a slower pace of outstanding-position growth.
Withdrawal transactions are becoming more prominent, while reserve data still needs to confirm whether supply is actually leaving exchanges.
Futures positions have eased from an elevated month
A CryptoQuant analysis found that XRP’s 30-day average open interest on Binance had reached an eight-month high of about $511 million. Its latest daily reading was lower, near $467 million, while the 30-day rolling open-interest Z-score stood around -0.99.
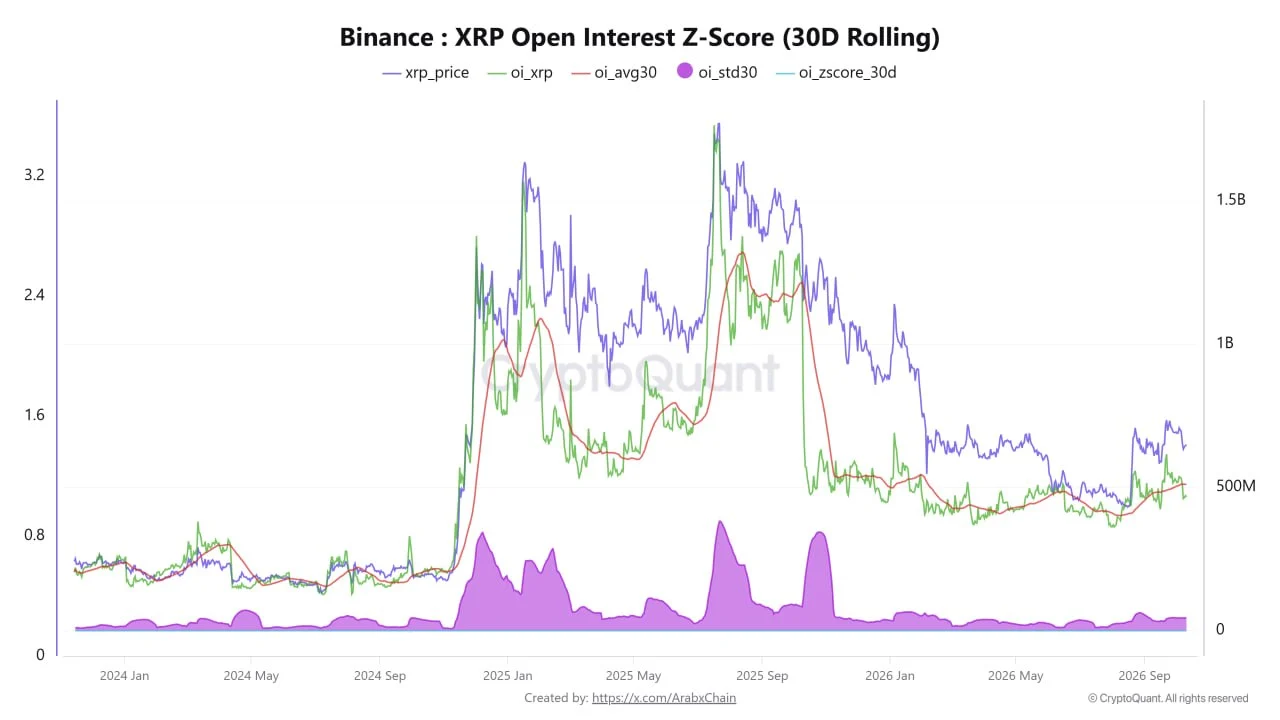
The comparison shows that the earlier surge in outstanding futures positions has eased from its recent average. Open interest includes contracts held by bullish and bearish traders, so the data cannot identify which side has been closing positions. It does show that XRP is carrying less current futures activity than the level that produced the eight-month monthly average.
Exchange activity gives only a partial supply picture
A second CryptoQuant reading noted a rising share of XRP withdrawal transactions while exchange-reserve trends diverged. Withdrawal dominance can indicate that more transfers are moving away from exchange wallets than toward them, which may reduce readily available supply in some circumstances.
Transaction share measures transfer frequency rather than net volume. A large number of small withdrawals can sit beside a few large exchange deposits, producing a very different supply picture from the one implied by transaction count. Broader reserve declines and netflow data would provide firmer evidence that XRP is leaving exchange balances at scale.
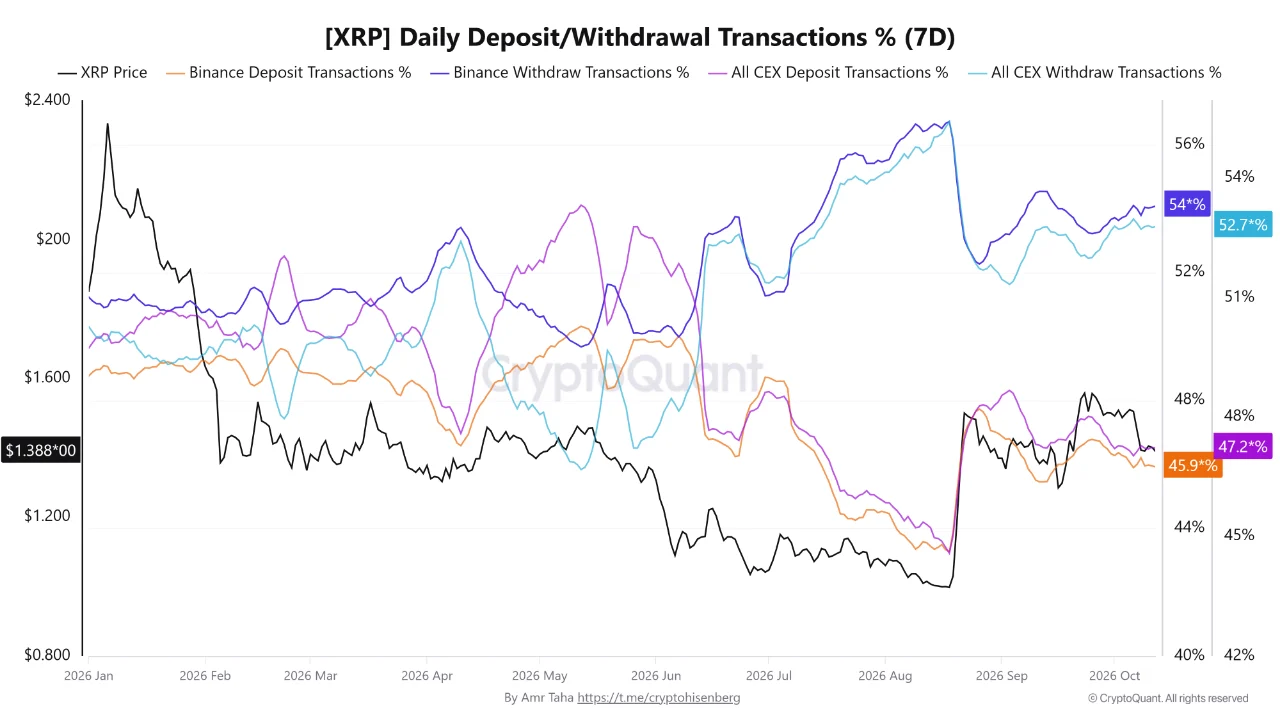
Withdrawal-heavy activity also appeared during an earlier period when Binance withdrawals exceeded deposits. The current setup differs because the latest flow reading now sits beside a futures market that has cooled from a much higher recent average.
The lower support zone tests the broader structure
If XRP cannot maintain the current pullback area, the daily chart points to a deeper range where several longer-term references gather. The zone’s relevance comes from the overlap of Fibonacci and moving-average levels, rather than one exact support price.
The 50-day SMA remains above the 200-day SMA, a constructive medium-term feature of the chart. The $1.26-$1.28 range gains its nearer importance from the 61.8% retracement and the 100-day and 200-day averages clustered around it; the moving-average cross provides the broader backdrop.
The golden cross supports the broader trend
XRP’s 50-day simple moving average has crossed above its 200-day average, forming a pattern known as a golden cross. Technical analysts usually read it as a constructive medium-term signal because the more recent price trend has become stronger than the longer-term one.
On this chart, the 50-day SMA sits near $1.425 and has become part of the immediate resistance cluster. The 200-day SMA is closer to $1.280, within the deeper $1.26-$1.28 support range alongside the 61.8% Fibonacci retracement and 100-day average. That convergence gives the lower zone significance if XRP’s present support fails.
A golden cross provides trend context rather than a price target. XRP would still need to reclaim the $1.425-$1.428 resistance area and hold above it for the recovery to strengthen. A move back below $1.34 could shift attention toward the lower moving-average and Fibonacci cluster, while reserve data and spot activity would help clarify whether exchange withdrawals reflect sustained demand.
This article is provided for informational purposes only and does not constitute financial or investment advice. Technical indicators and onchain metrics are interpretive tools, not guarantees of future price movement.
The post XRP Flashes Golden Cross: Will It Break $1.43 Resistance? appeared first on Coindoo.
Source: https://coindoo.com/xrp-flashes-golden-cross-will-it-break-1-43-resistance/


More Crypto News
Check our Market Overview
Disclaimer: This article is for informational purposes only and does not constitute financial advice. Always conduct your own research (DYOR).