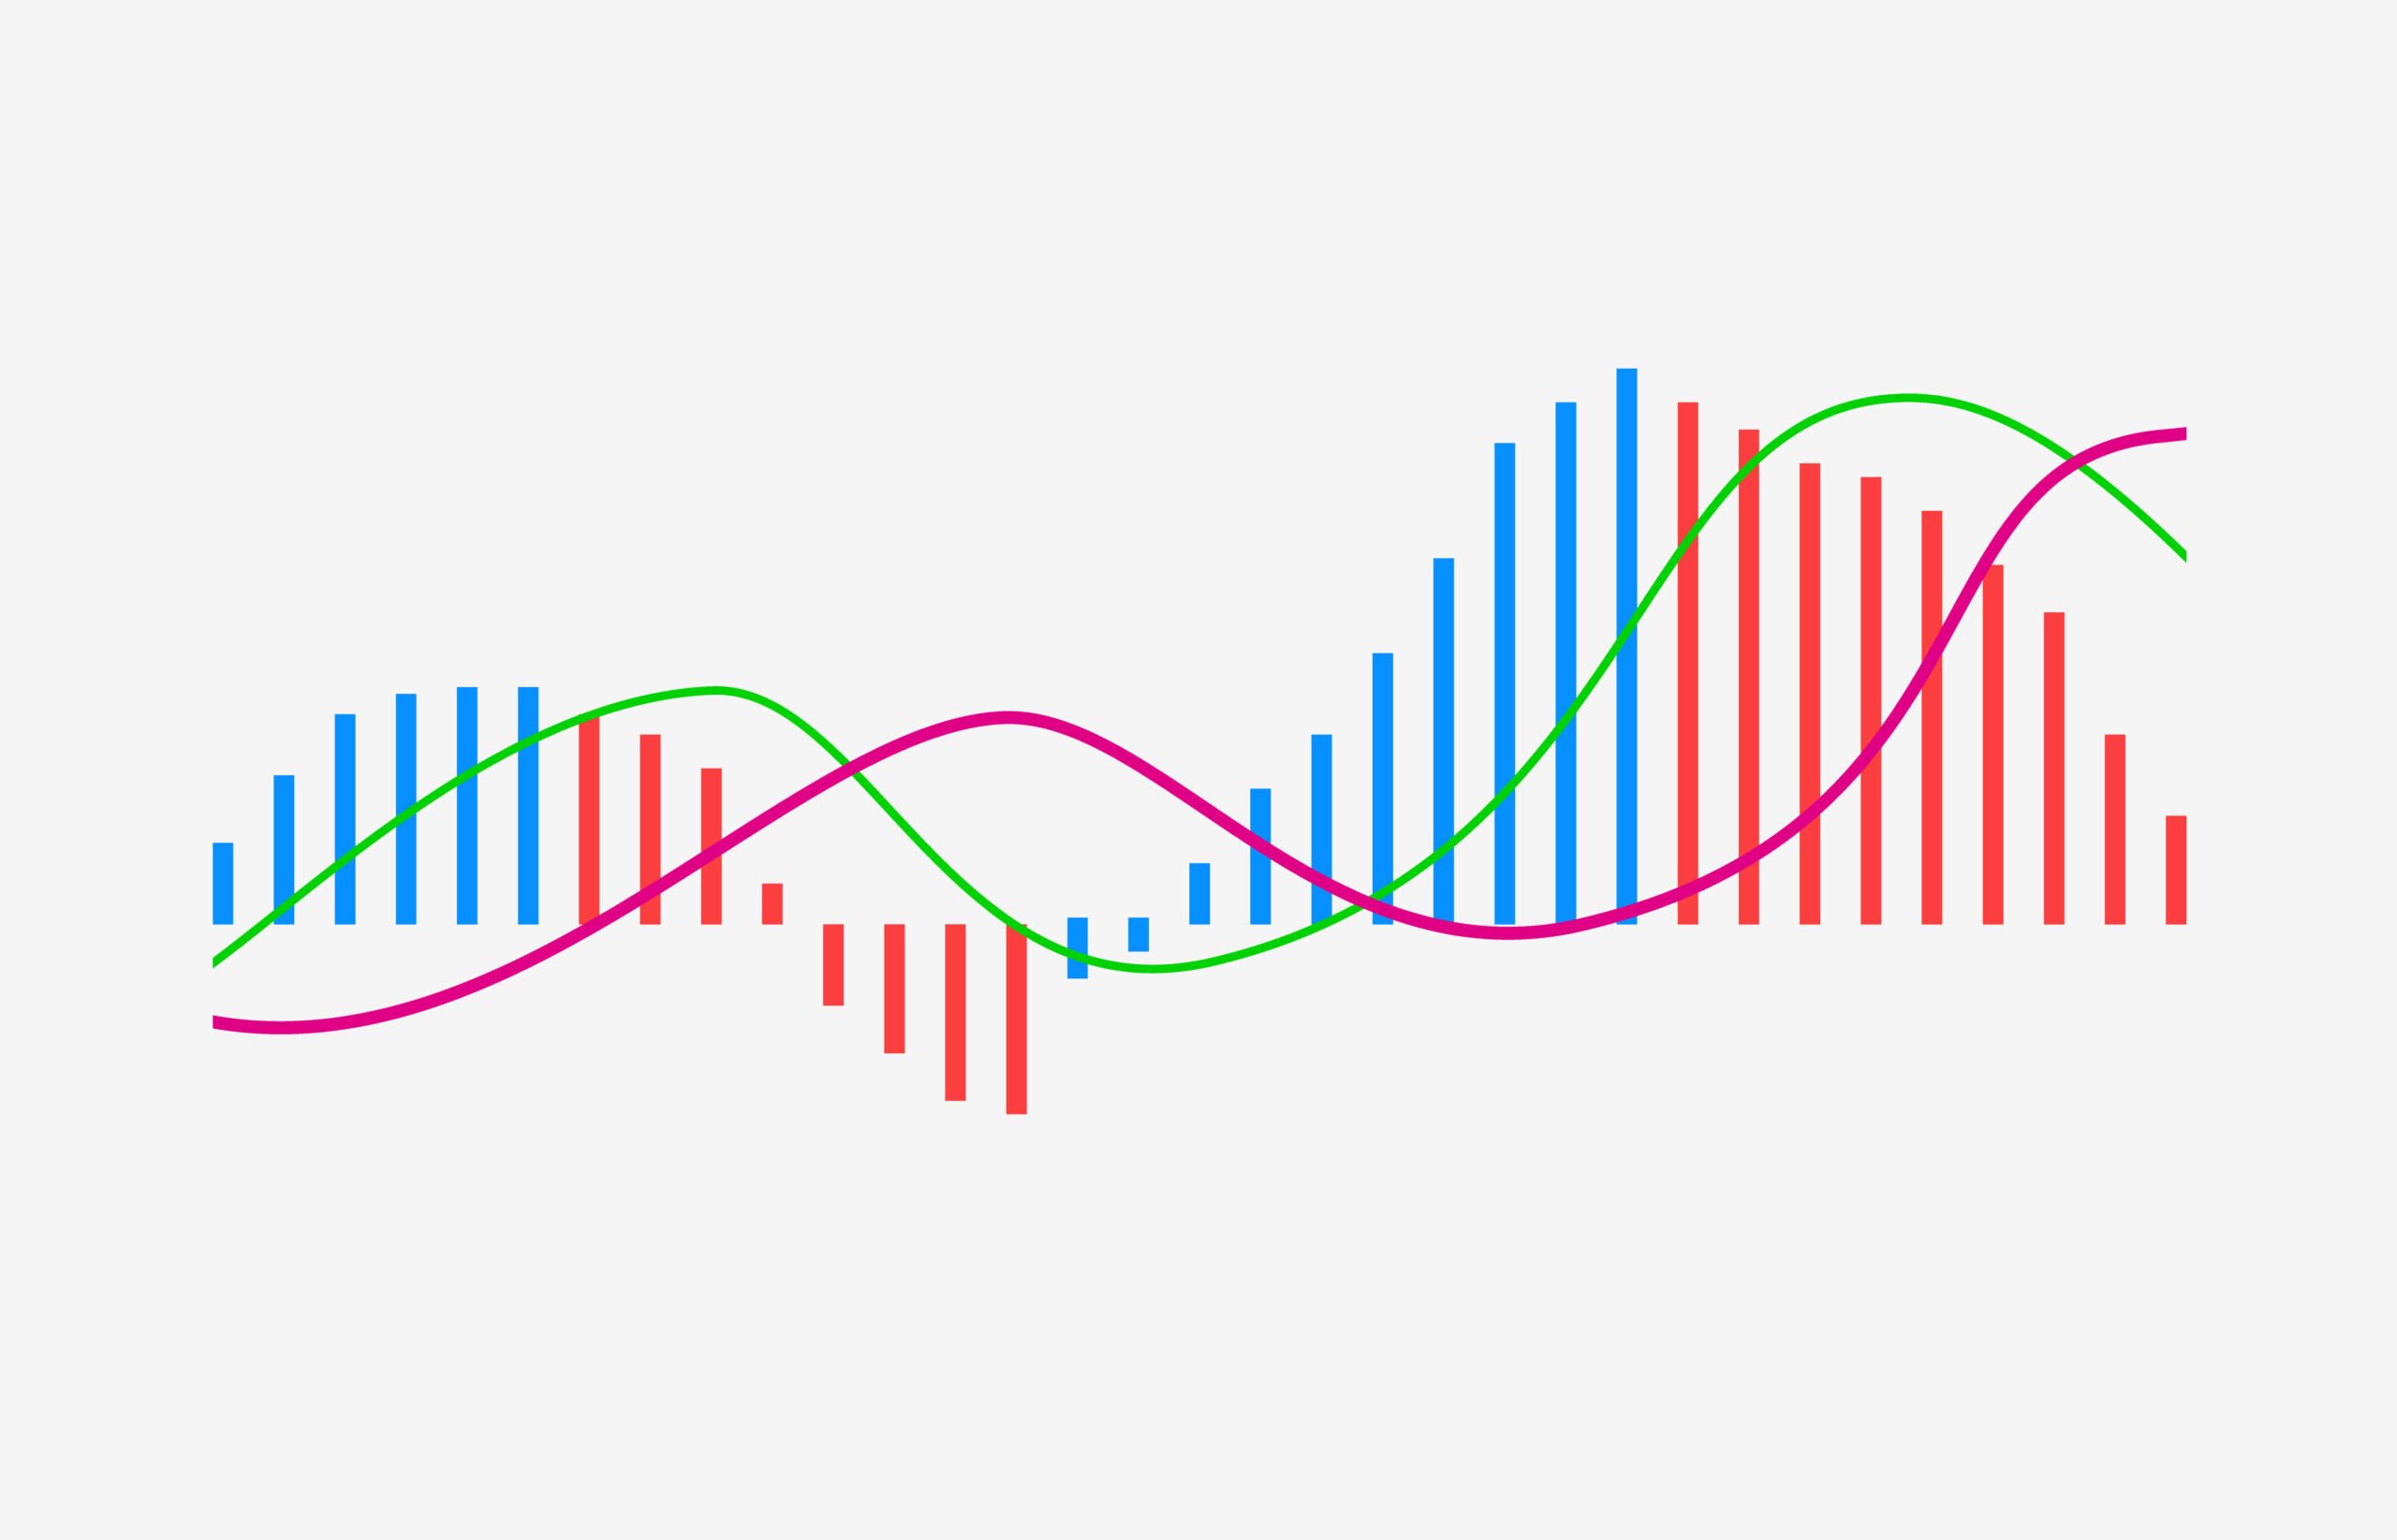
The Moving Average Convergence Divergence (MACD) indicator is widely recognized as one of the most popular and versatile technical indicators used in trading, including cryptocurrency trading. Developed by Gerald Appel in 1979, the MACD is a trend-following oscillator that measures the relationship between two exponential moving averages (EMAs) of an asset’s price. This article will provide an in-depth exploration of the utility and application of the MACD indicator in cryptocurrency trading, highlighting its key components, interpretation, and practical use.
I. Components of the MACD Indicator:
The MACD indicator consists of three main components:
MACD Line: The MACD line is calculated by subtracting the longer-term EMA (typically the 26-day EMA) from the shorter-term EMA (typically the 12-day EMA). It represents the difference between these two EMAs and is considered the primary component of the MACD indicator.
Signal Line: The signal line, also known as the trigger line, is a 9-day EMA of the MACD line. It helps generate trading signals when it crosses above or below the MACD line.
-----Cryptonews AD----->>> <<<-----Cryptonews AD-----
Histogram: The histogram is derived from the difference between the MACD line and the signal line. It provides a visual representation of the convergence and divergence between these two lines. Positive histogram bars indicate bullish momentum, while negative bars suggest bearish momentum.
II. Interpreting the MACD Indicator:
Traders interpret the MACD indicator in various ways to identify potential entry and exit points, determine market trends, and assess the strength of price movements. Here are some key interpretations:
Crossovers: When the MACD line crosses above the signal line, it generates a bullish signal, indicating a potential buying opportunity. Conversely, when the MACD line crosses below the signal line, it generates a bearish signal, suggesting a potential selling opportunity.
Divergence: Divergence occurs when the MACD indicator moves in the opposite direction of the price action. Bullish divergence occurs when the price makes lower lows while the MACD indicator makes higher lows. Conversely, bearish divergence occurs when the price makes higher highs while the MACD indicator makes lower highs. Divergence can signal potential trend reversals.
Histogram Patterns: Traders also analyze the shape and pattern of the histogram bars. Increasing or widening histogram bars indicate rising momentum, while decreasing or contracting bars suggest weakening momentum. Histogram patterns, such as convergences and divergences, can provide additional insights into the strength of a trend.
III. Practical Application in Cryptocurrency Trading:
The MACD indicator can be applied in various ways to enhance cryptocurrency trading strategies. Here are some practical applications:
Identifying Trend Reversals: Traders can use MACD crossovers and divergence to identify potential trend reversals. Bullish crossovers and bullish divergence can indicate a shift from a bearish trend to a bullish trend, while bearish crossovers and bearish divergence can suggest a shift from a bullish trend to a bearish trend.
Confirming Trade Entries and Exits: MACD crossovers, particularly when combined with other technical indicators or chart patterns, can provide confirmation for trade entries and exits. For example, a trader might enter a long position when the MACD line crosses above the signal line and the price breaks above a key resistance level.
Assessing Momentum and Strength: The MACD histogram can help assess the momentum and strength of a price movement. Traders look for increasing or decreasing histogram bars to gauge the strength of a trend. Rising histogram bars suggest growing momentum, while decreasing bars may indicate a potential trend reversal or weakening momentum.
Incorporating Timeframes: The MACD indicator can be used on different timeframes, ranging from short-term to long-term. Traders often use multiple timeframes to gain a comprehensive view of the market and confirm signals. For instance, a trader might use a shorter-term MACD on a 4-hour chart for trade entries and a longer-term MACD on a daily chart to identify the overall market trend.
The MACD indicator is a versatile tool for cryptocurrency traders, offering insights into trend reversals, trade entries and exits, and momentum assessment. By understanding the components of the MACD and interpreting its signals, traders can incorporate this powerful indicator into their cryptocurrency trading strategies. However, it’s essential to use the MACD in conjunction with other technical analysis tools and consider market conditions for more accurate decision-making.
Disclaimer: The information provided in this article is for educational purposes only and should not be construed as financial advice. Cryptocurrency trading involves risks, and traders should conduct their own research and analysis before making any investment decisions.
References:
[1] Moving Average Convergence Divergence (MACD). Investopedia. Link
[2] What Is the MACD Indicator and How to Use It in Crypto Trading. CoinMarketCap. Link
[3] Cryptocurrency Technical Analysis: Moving Average Convergence Divergence (MACD). Liquid Blog. Link
[4] Explained: MACD Indicator & How to Apply It in Crypto Trading. Bybit Learn. Link
[5] What Is an MACD Indicator and How to Use It in Crypto Trading. CoinSwitch. Link
[6] MACD Indicator: Crypto Trading. Phemex Academy. Link


