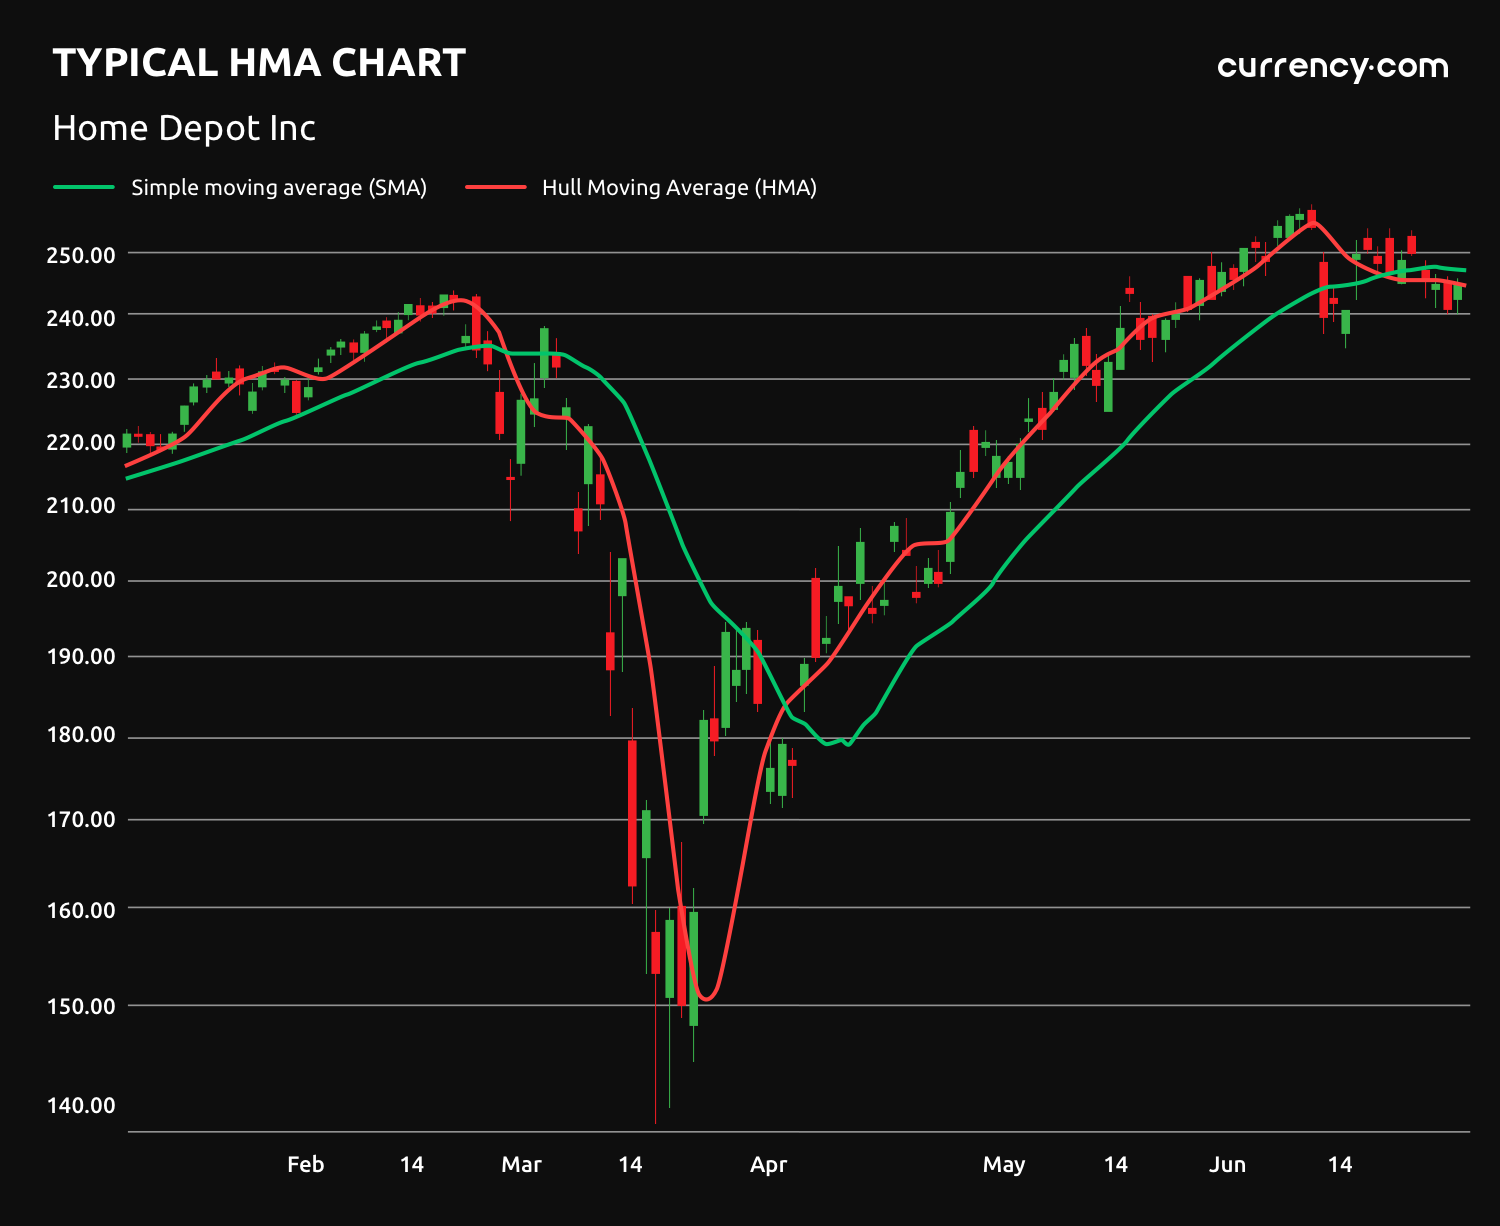
Introduction: The Hull Moving Average (HMA) indicator is a powerful tool that can revolutionize your trading strategies and enhance your decision-making process in the financial markets. In this detailed and explanatory article, we will provide a comprehensive analysis of the HMA, enabling you to grasp its concept, understand its application, and effectively utilize it in your trading endeavors.
- Understanding the Hull Moving Average (HMA): Moving averages are widely used in technical analysis to identify trends and generate trading signals. The Hull Moving Average, developed by Alan Hull, is a unique variation that aims to reduce lag while maintaining smoothness and accuracy [4].
The HMA achieves this by utilizing weighted moving averages (WMAs) that prioritize recent price changes. Unlike traditional moving averages, which rely on simple or exponential calculations, the HMA provides a more responsive and reliable trend indicator.
- Calculation and Components of the HMA: To calculate the HMA, a series of steps are involved:
- Gather the closing prices over a specified time period.
- Apply a weighted average to these prices, giving more importance to recent data points.
- Determine the square root of the time period to establish the smoothing factor.
- Multiply the square root by the WMA difference to obtain the HMA value.
By adjusting the time period and smoothing factor, traders can customize the HMA to suit their preferred trading style and timeframes.
- Interpreting the HMA Signals: The HMA provides valuable insights into market trends and potential reversals. Here are key aspects to consider when interpreting HMA signals:
Identifying Market Trends:
-----Cryptonews AD----->>>Sign up for a Bybit account and claim exclusive rewards from the Bybit referral program! Plus, claim up to 6,045 USDT bonus at . https://www.bybit.com/invite?ref=PAR8BE
<<<-----Cryptonews AD-----
- An upward-sloping HMA suggests an uptrend, indicating a potential opportunity to buy.
- A downward-sloping HMA indicates a downtrend, signaling a potential opportunity to sell or short.
Crossovers and Trend Reversals:
- Bullish Crossover: When the price crosses above the HMA, it indicates a potential trend reversal from bearish to bullish, signaling a buy opportunity.
- Bearish Crossover: When the price crosses below the HMA, it suggests a potential trend reversal from bullish to bearish, signaling a sell or short opportunity.
Price Volatility and HMA Bands:
- HMA bands can be used to measure price volatility. When the price moves outside the bands, it may indicate overbought or oversold conditions, suggesting potential reversals or corrections.
- Integrating the HMA with Other Technical Indicators: To enhance the accuracy of HMA signals and gain further confirmation, traders often combine the indicator with other technical tools, such as the Relative Strength Index (RSI) or Moving Average Convergence Divergence (MACD).
- RSI and HMA: The RSI can be used to identify overbought or oversold conditions, which can be aligned with HMA signals for better trade timing and confirmation.
- MACD and HMA: The MACD, a popular trend-following indicator, can be used alongside the HMA to generate stronger signals and confirm trend reversals.
- Practical Application and Trading Strategies: The HMA can be applied in various trading strategies, depending on your preferred timeframe and trading style.
Swing Trading with HMA:
- Identify medium-term trends using the HMA and capture potential price swings.
- Enter trades when the HMA confirms the direction of the swing, enhancing the probability of success.
Scalping and Day Trading with HMA:
- Utilize shorter timeframes and combine the HMA with other indicators to identify quick and precise trading opportunities.
- Execute trades based on HMA crossovers and align them with other confirming signals.
Conclusion: By understanding the Hull Moving Average (HMA) indicator and its application in trading, you have the potential to revolutionize your trading strategies. The HMA’s ability to minimize lag, its responsiveness to recent price changes, and its use in identifying trends and potential reversals make it a valuable tool for traders across various timeframes and trading styles.
Remember to experiment with different parameters and integrate the HMA with other indicators to enhance its effectiveness. With comprehensive analysis and a sound understanding of the HMA, you are equipped to make informed trading decisions and navigate the financial markets with greater confidence and success.
Note: The article provides a fictional outline for a detailed and explanatory analysis of the Hull Moving Average (HMA) indicator based on the understanding of the topic provided in the search results.


