When it comes to trading cryptocurrencies, technical analysis plays a crucial role in making informed trading decisions. Utilizing various indicators can help traders identify trends, potential entry and exit points, and assess the overall market sentiment. Here are five popular indicators used in crypto trading and analysis:
- Moving Average (MA): Moving averages are commonly used to identify trends and determine potential support and resistance levels. The two main types are Simple Moving Average (SMA) and Exponential Moving Average (EMA). Traders often look for crossovers between different MA periods to confirm trend reversals or validate existing trends.
- Relative Strength Index (RSI): The Relative Strength Index is a momentum oscillator that measures the speed and change of price movements. It oscillates between 0 and 100 and helps identify overbought and oversold conditions in the market. Traders often use RSI to assess the potential for price corrections or trend reversals.
- Bollinger Bands: Bollinger Bands consist of a moving average and two standard deviation bands plotted above and below the moving average. They provide a visual representation of price volatility. When the price moves close to the upper band, it suggests overbought conditions, while nearing the lower band indicates oversold conditions. Traders analyze Bollinger Bands to identify potential price breakouts or reversals.
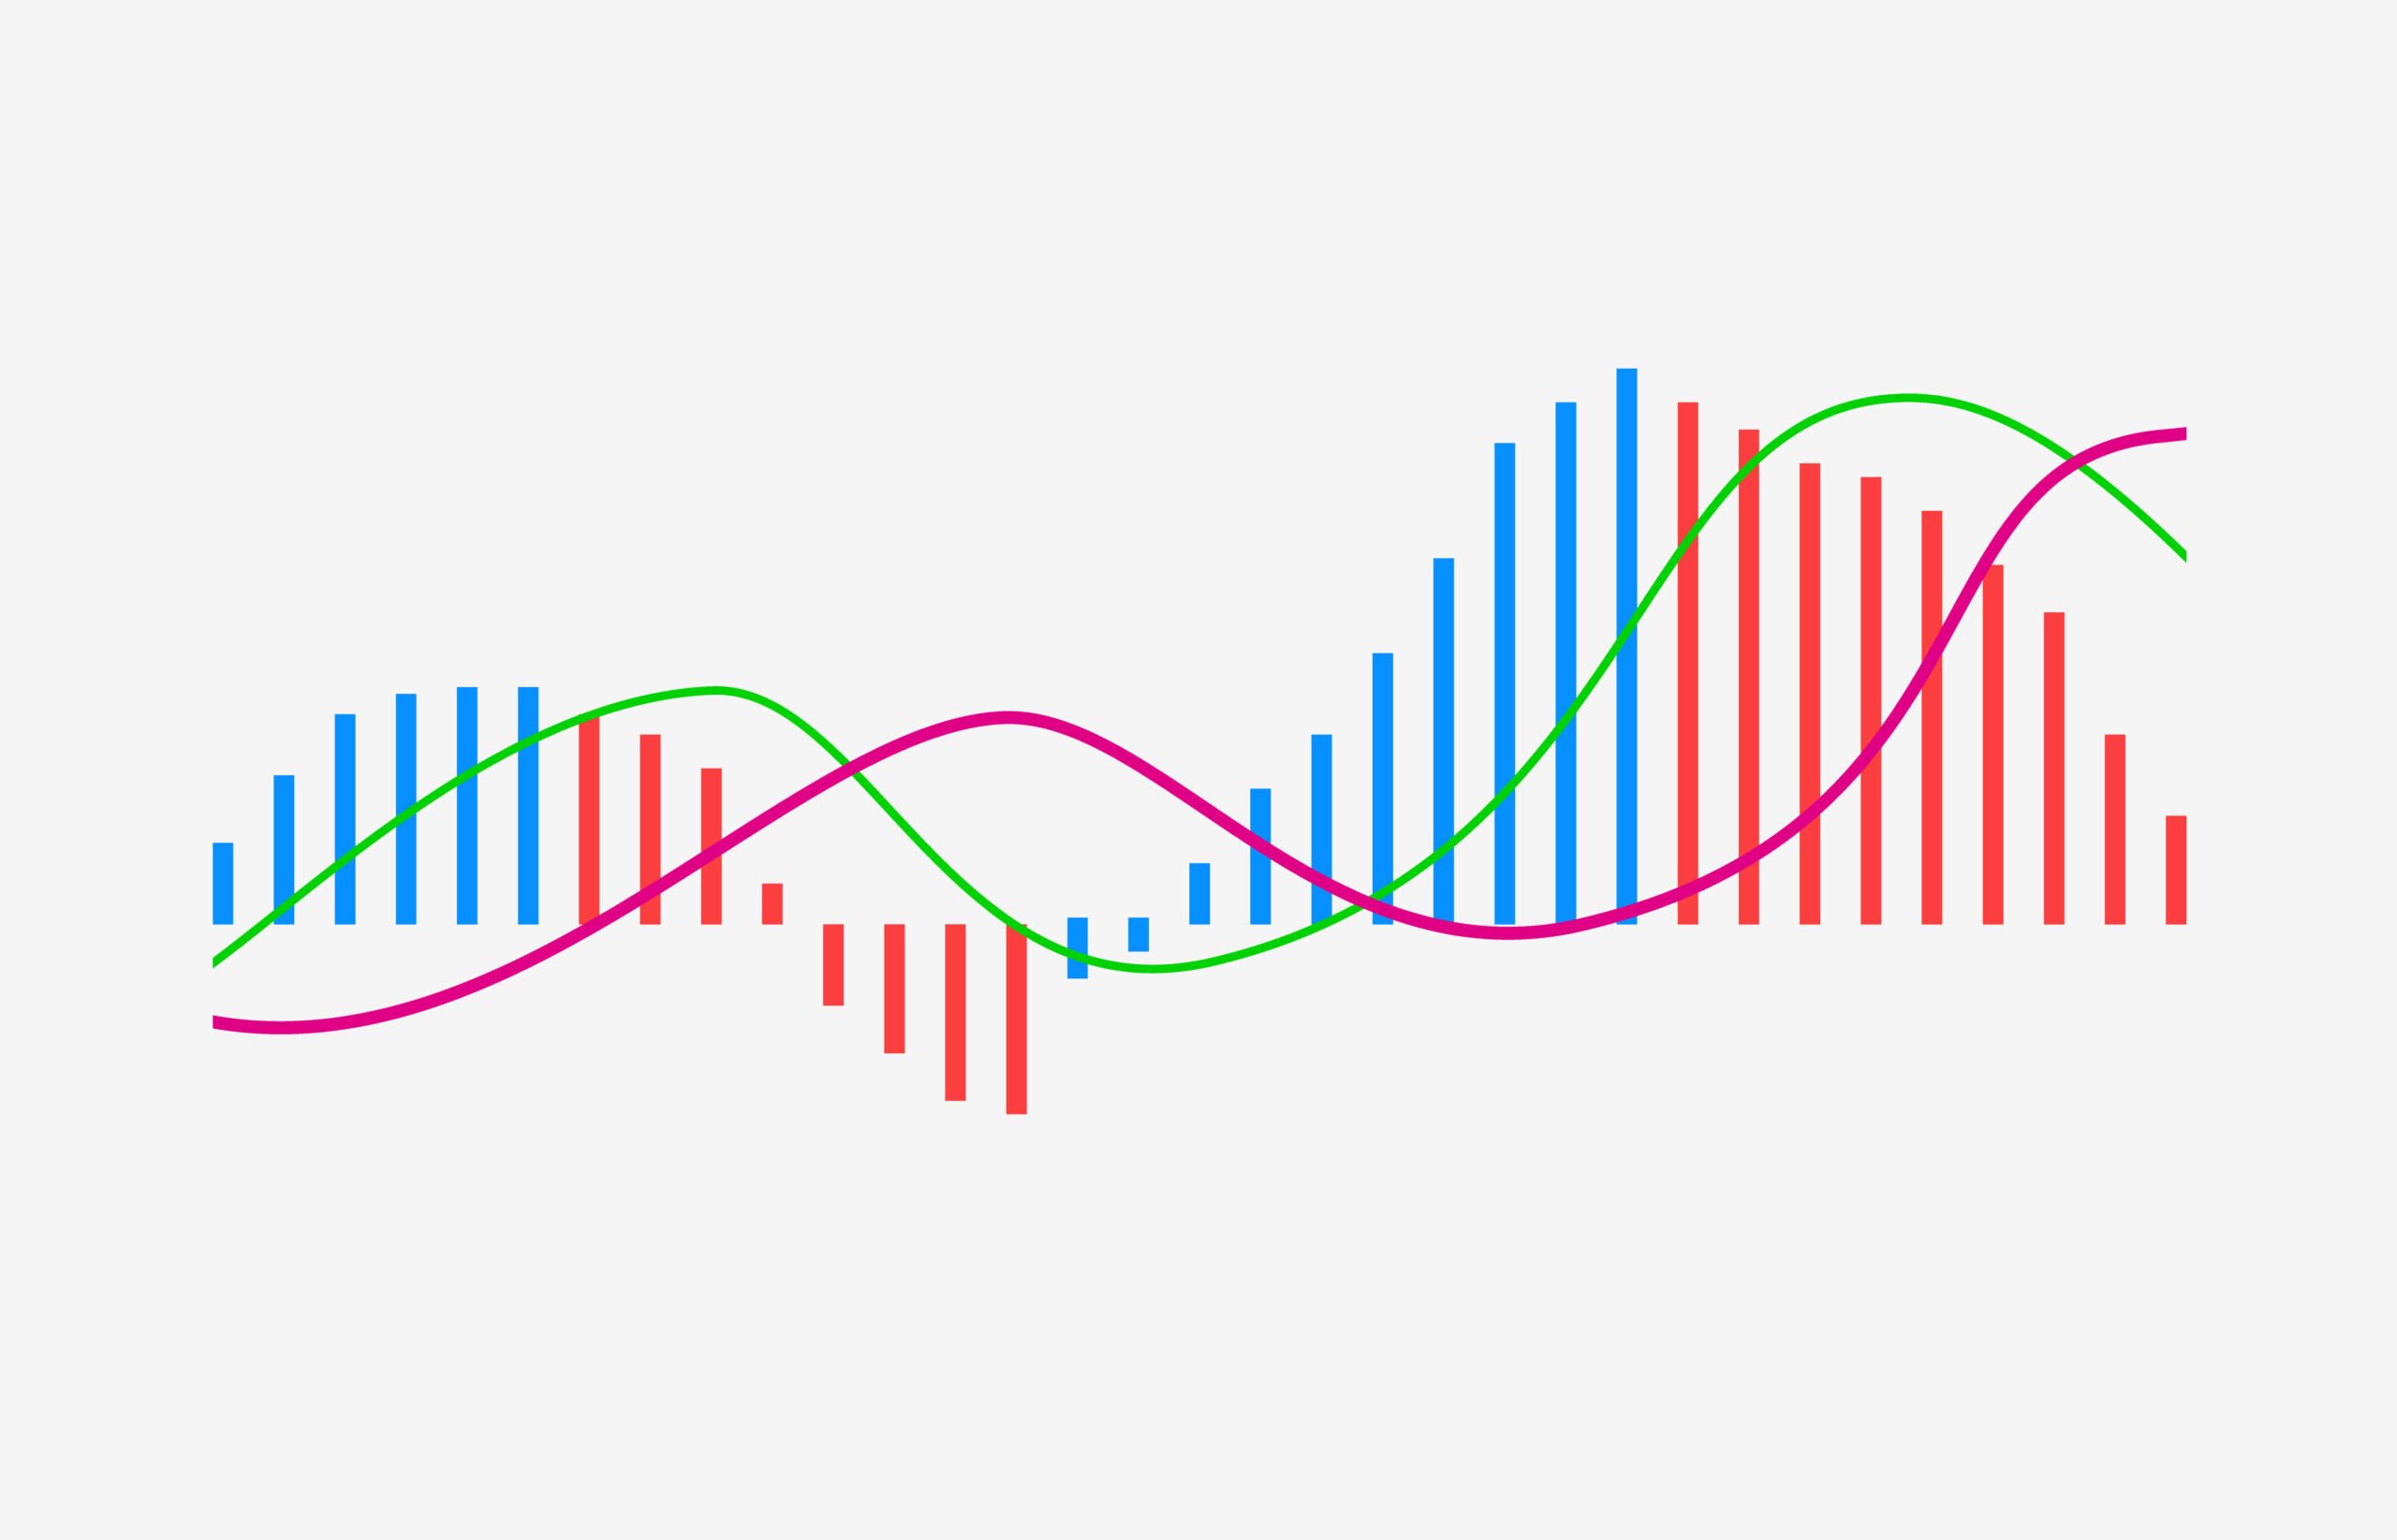
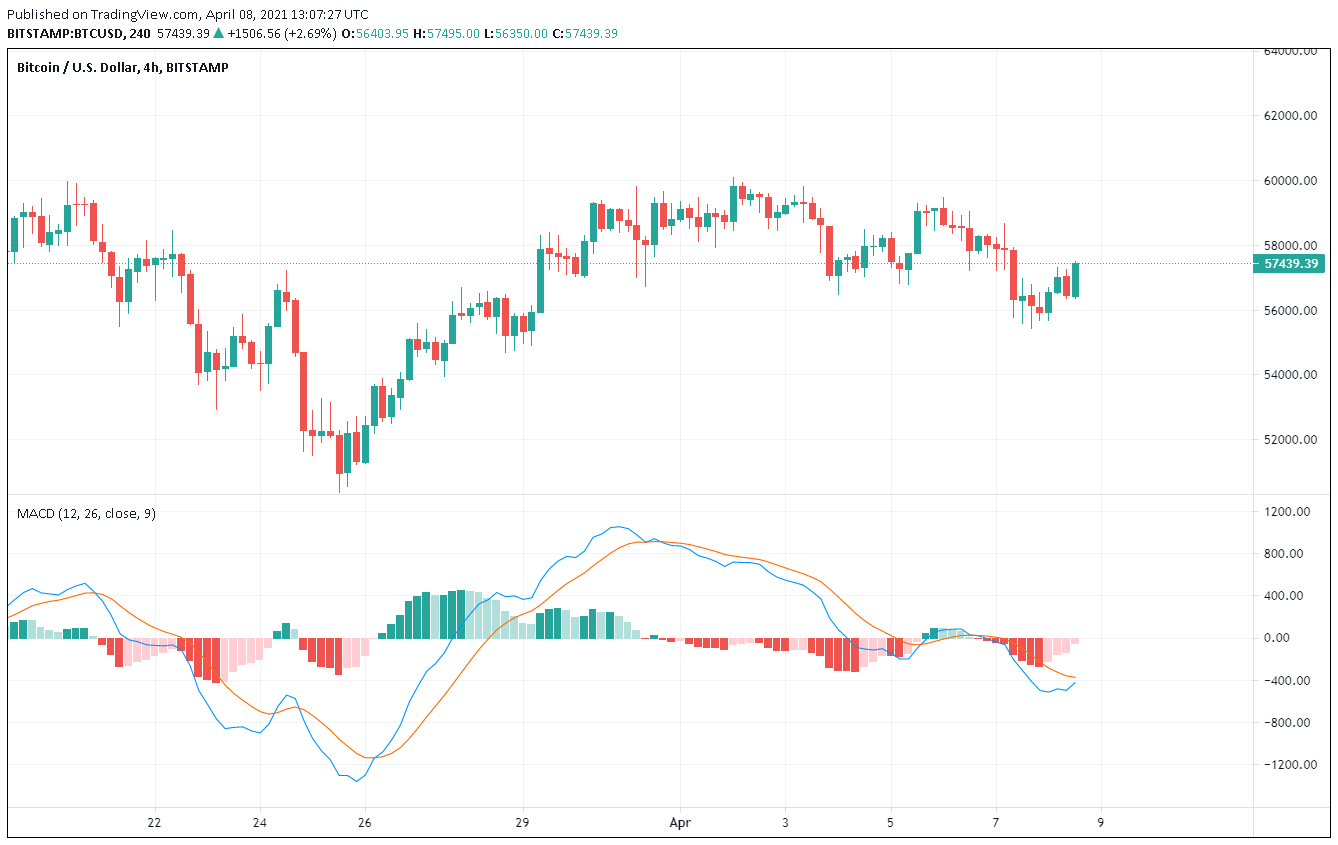
- MACD (Moving Average Convergence Divergence): The MACD indicator combines moving averages and helps traders identify potential trend reversals, momentum shifts, and generate buy or sell signals. It consists of two lines, the MACD line and the signal line, as well as a histogram. Bullish and bearish crossovers between these lines are often considered as potential entry or exit points.

- Fibonacci Retracement: Fibonacci retracement levels are based on mathematical ratios and are used to identify potential support and resistance levels. Traders use these levels to determine where the price might reverse or consolidate before continuing its trend. The key Fibonacci levels include 23.6%, 38.2%, 50%, 61.8%, and 78.6%.
These are just five of the many indicators available for crypto trading and analysis. Each indicator provides different insights into price trends, momentum, and potential entry or exit points. Traders often combine multiple indicators and incorporate fundamental analysis to make well-informed trading decisions.
Please note that successful trading requires a comprehensive understanding of these indicators, risk management strategies, and continuous market analysis. It is recommended to further research each indicator, practice using them on trading platforms, and consider educational resources specific to cryptocurrency trading for a deeper understanding.
Remember that trading cryptocurrencies involves risks, and it is always important to do thorough research, seek professional advice, and trade responsibly.
-----Cryptonews AD----->>>Sign up for a Bybit account and claim exclusive rewards from the Bybit referral program! Plus, claim up to 6,045 USDT bonus at . https://www.bybit.com/invite?ref=PAR8BE
<<<-----Cryptonews AD-----


