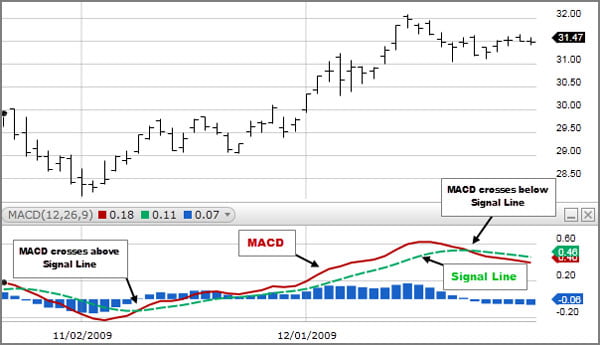
The Moving Average Convergence Divergence (MACD) indicator is a popular tool used in technical analysis to identify trend reversals. It is calculated by subtracting the 26-day exponential moving average (EMA) from the 12-day EMA. The MACD line is the difference between these two EMAs, and the signal line is a 9-day EMA of the MACD line.
How to Use the MACD to Identify Trend Reversals
There are two main ways to use the MACD to identify trend reversals:
- Crossovers
- Divergences
Crossovers
-----Cryptonews AD----->>>Sign up for a Bybit account and claim exclusive rewards from the Bybit referral program! Plus, claim up to 6,045 USDT bonus at . https://www.bybit.com/invite?ref=PAR8BE
<<<-----Cryptonews AD-----
A crossover occurs when the MACD line crosses above or below the signal line. A bullish crossover occurs when the MACD line crosses above the signal line, indicating that the trend may be reversing from bearish to bullish. A bearish crossover occurs when the MACD line crosses below the signal line, indicating that the trend may be reversing from bullish to bearish.
Divergences
A divergence occurs when the price action and the MACD line are moving in different directions. A bullish divergence occurs when the price action is declining while the MACD line is rising, indicating that the trend may be reversing from bearish to bullish. A bearish divergence occurs when the price action is rising while the MACD line is declining, indicating that the trend may be reversing from bullish to bearish.
Combining the MACD with Other Indicators
The MACD can be used in combination with other technical indicators to improve your trading accuracy. Some popular indicators to use with the MACD include:
- The relative strength index (RSI)
- The moving average convergence divergence histogram (MACD histogram)
- The Bollinger bands
Example
Let’s say that the price of a cryptocurrency is in an uptrend. The MACD line is above the signal line, and the MACD histogram is positive. However, the MACD line starts to cross below the signal line. This is a signal that the trend may be reversing.
To confirm the reversal, you could look for a divergence between the MACD line and the price action. For example, the price of the cryptocurrency could start to decline while the MACD line remains above the signal line. This would be a strong signal that the trend is reversing.
Conclusion
The MACD is a powerful tool that can be used to identify trend reversals in cryptocurrencies. By understanding how to use the MACD, you can improve your trading accuracy and make more informed trading decisions.
Additional Tips for Using the MACD
- Use multiple timeframes
The MACD can be used to identify trend reversals on different timeframes. For example, you could use the MACD on the daily timeframe to identify long-term trends, and the MACD on the 4-hour timeframe to identify shorter-term trends.
- Consider other market factors
The MACD is not a perfect indicator. It is important to consider other market factors, such as news and events, when making trading decisions.
- Be patient
The MACD can be a lagging indicator. It may take some time for the MACD to signal a trend reversal.
By following these tips, you can improve your chances of success when using the MACD to identify trend reversals in cryptocurrencies.


