In this post, we will discuss about the possible Bitcoin price scenario for next couple of days. Bitcoin broke above the $100,000 level in anticipation of the Donald Trump inauguration and now going sideways. Let’s see what is on the charts.
Bitcoin Daily Time Frame Analysis

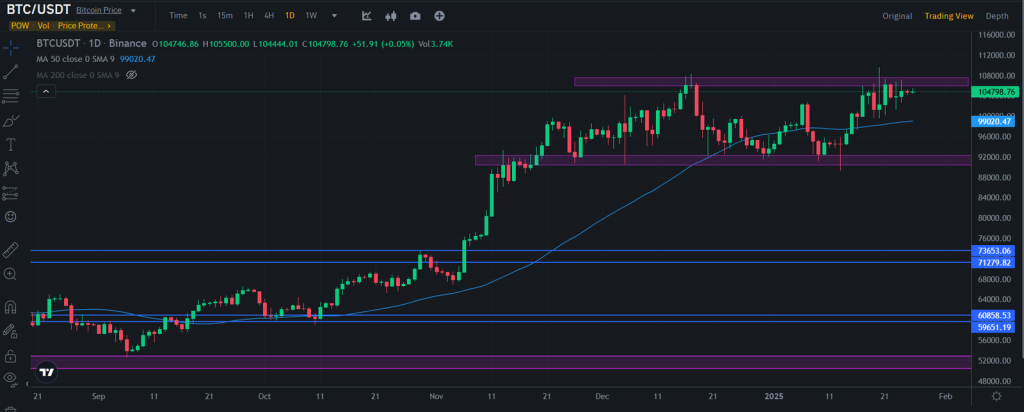
$BTC is facing resistance at the $106,000 area and is unable to close a candle above this zone. Price consistently testing the resistance area and the wicks showing price rejection and heavy selling. Price is trading above the 50 Daily Moving Average (DMA) and this is a good sign. The Chinese New Year is here and we may see some action from the next week.
Bitcoin 4-hour Timeframe Analysis

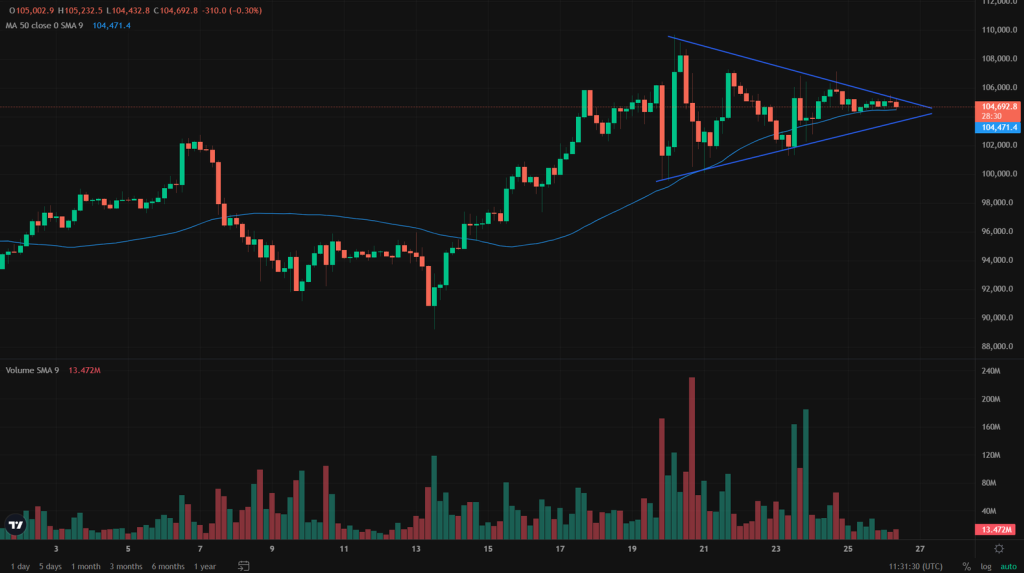
Bitcoin is forming a symmetric triangle pattern on a 4-hour chart. We will see a breakout of this triangle in either direction and that will decide the next move. Price is taking support at the 50 simple moving average line and a break below this is bearish. A break in the downward direction will send the price towards the $100,000 key level. A break in upward direction will open gates for new all-time high price.
Bitcoin Price Predication – Technical Analysis BTC
-----Cryptonews AD----->>> <<<-----Cryptonews AD-----
Source: https://bitcoinik.com/bitcoin-price-predication-technical-analsis-btc/feed/


