Key Takeaways Bitcoin approaching $76–79K resistance after nearly two months, currently trading around $71K BlackRock’s Bitcoin ETF (IBIT) gained 1.5% […]
The post Bitcoin Climbs Toward Critical Resistance as Gold Capital Rotates Into Crypto appeared first on Coindoo.
Key Takeaways
- Bitcoin approaching $76–79K resistance after nearly two months, currently trading around $71K
- BlackRock’s Bitcoin ETF (IBIT) gained 1.5% inflows while gold ETF GLD lost 2.7% in the same window
- Gold has shed over $200 from recent highs and is edging toward the $5,000 level; silver is also retreating
- A 100 EMA retest signal – historically reliable since 2014 – has reportedly fired on Bitcoin
The Rotation Nobody’s Talking About
The move comes alongside something arguably more significant than the chart itself: institutional money appears to be quietly rotating out of gold and into Bitcoin — and the macro backdrop is making that case harder to ignore by the day.
Gold is sitting at roughly $5,020 per ounce as of Friday morning, having pulled back sharply from recent highs near $5,296. Silver is faring no better, changing hands at $80 0 a $3.36 drop in 24 hours. Both metals are bleeding from their peaks, and gold is now dangerously close to the psychologically significant $5,000 mark. For an asset that spent months being bid up as the world’s premier crisis hedge, that’s a notable stall.


The ETF flow data tells the more revealing story. As pere data shared by CoinBureau CEO, Between February 27 and March 9, BlackRock’s Bitcoin ETF IBIT recorded inflows of roughly 1.5% of its AUM. Over that same window, the largest gold ETF – GLD – shed approximately 2.7%. That’s not noise. That’s a directional shift. Gold has functioned as the world’s go-to crisis hedge for decades, and during the current stretch of geopolitical tension, it appears some of that allocation is being redirected. Not into equities, not into bonds – into Bitcoin.
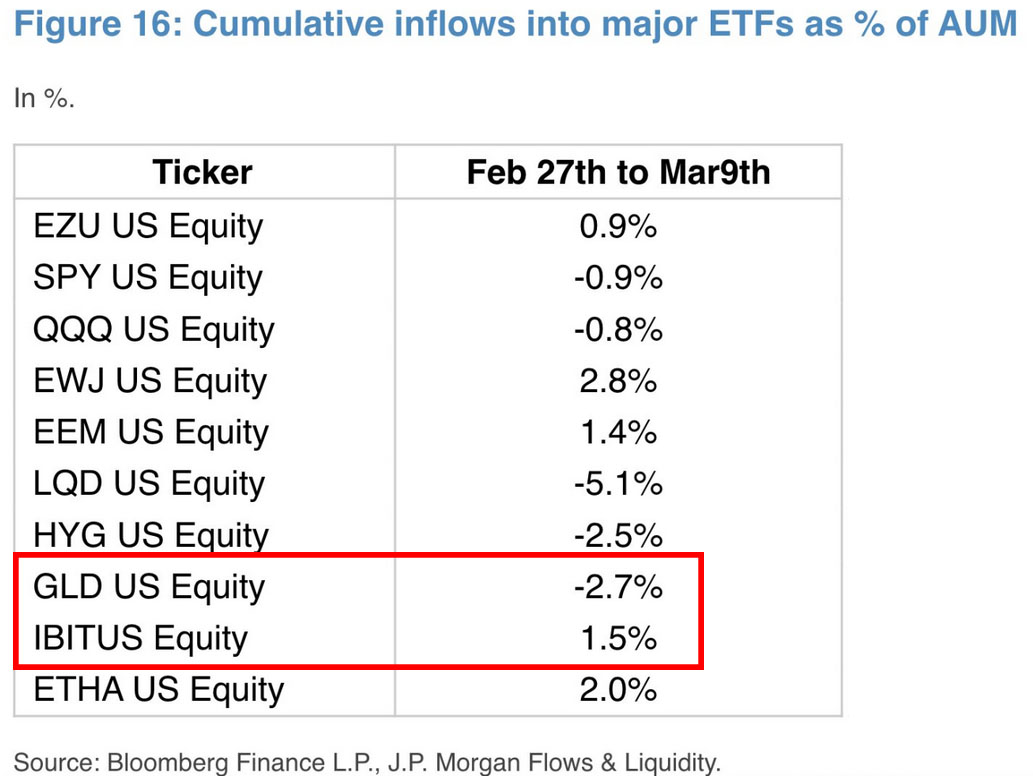
The data, sourced from Bloomberg Finance and J.P. Morgan Flows & Liquidity, shows broader market stress too: LQD lost 5.1%, HYG dropped 2.5%, SPY slipped 0.9%. In that context, Bitcoin absorbing institutional inflows while traditional safe havens bleed is a meaningful signal.
It suggests a growing segment of institutional capital is beginning to treat Bitcoin as a legitimate store-of-value asset – not just a speculative trade. The fact that this is happening while gold approaches a major psychological floor makes the rotation even harder to dismiss as coincidental.

Analyst Michaël van de Poppe notes that Bitcoin is approaching what he sees as a key resistance band between $76,000 and $79,000. He doesn’t expect a clean, single-candle breakout through that zone, but sees the altcoin market showing stronger relative momentum – which he views as constructive.
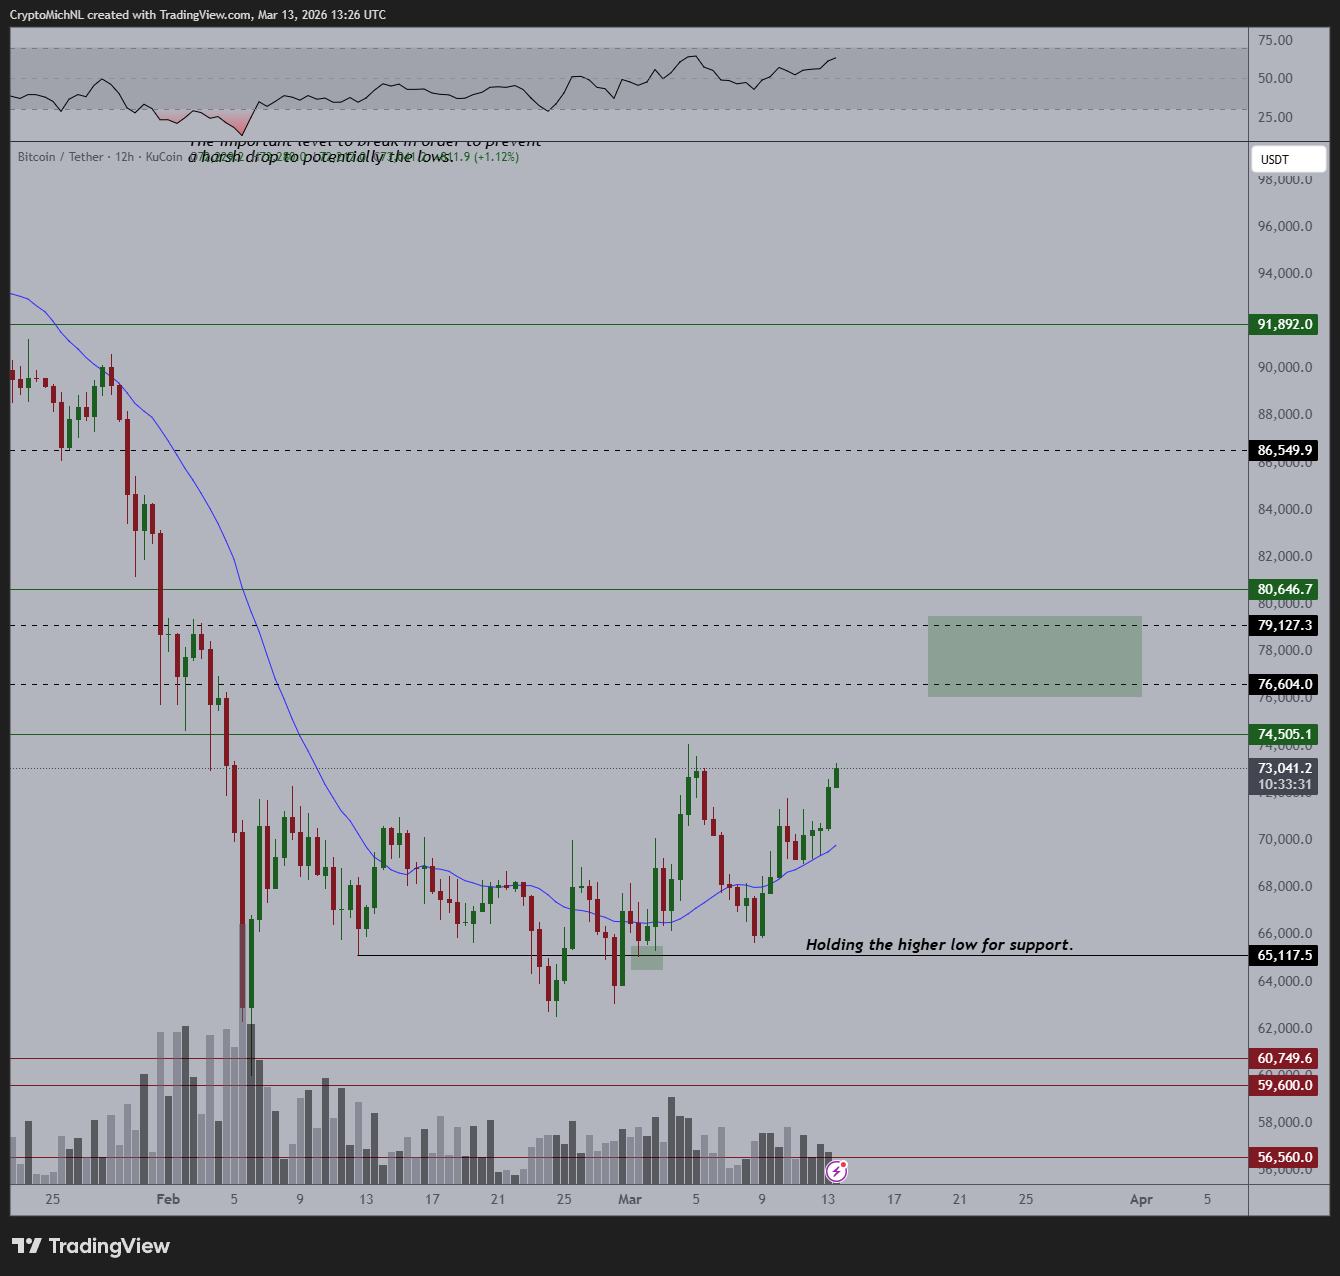
The more important point he raises: if Bitcoin manages to close above that range on the monthly chart, it would effectively erase the entire February correction and eliminate the argument for new lows.
Separately, trader Merlijn The Trader is pointing to a longer-standing signal – a return to the 100-week EMA – which he claims has historically preceded major Bitcoin moves going back to 2014.
His framework is binary: above $70,000 confirms the signal; below $65,000 suggests one more dip before any sustained upside. At $71K, Bitcoin sits just above the confirmation threshold. Whether that holds is the question.
THE BITCOIN BUY SIGNAL THAT HAS WORKED SINCE 2014.
Buy when price returns to the 100 EMA.
Reduce risk when it loses the WMA14.BTC is now testing the trend again.
Above $70K: signal confirmed.
Below $65K: final dip before the move.The simplest signals are always the most… pic.twitter.com/9ppmQSwb4J
— Merlijn The Trader (@MerlijnTrader) March 13, 2026
Why This Time Feels Different
What makes this moment worth watching isn’t just Bitcoin’s price level – it’s the structural story underneath. Gold pulling back toward $5,000 while Bitcoin climbs toward $76K, with ETF flows actively moving in opposite directions, paints a picture that was largely theoretical just a year ago. Geopolitical instability has historically driven capital into gold. The fact that this cycle is showing even a partial diversion of that flow into Bitcoin speaks to a maturing perception of the asset.
Gold is expected to remain volatile in the coming week, with key support sitting around $4,996 – a level that, if broken, would mark a significant psychological shift for precious metals investors. If that happens while Bitcoin holds above $70K and continues absorbing flows, the rotation narrative stops being a talking point and starts being a trend.
The $76–79K zone remains the immediate test for Bitcoin. A clean monthly close above it could change the narrative significantly. Until then, Bitcoin is doing exactly what it needs to – hold higher lows, absorb selling pressure, and let gold’s stumble make the case for it.
The information provided in this article is for educational purposes only and does not constitute financial, investment, or trading advice. Coindoo.com does not endorse or recommend any specific investment strategy or cryptocurrency. Always conduct your own research and consult with a licensed financial advisor before making any investment decisions.
The post Bitcoin Climbs Toward Critical Resistance as Gold Capital Rotates Into Crypto appeared first on Coindoo.
Source: https://coindoo.com/market/bitcoin-climbs-toward-critical-resistance-as-gold-capital-rotates-into-crypto/
More Crypto News
Check our Market Overview
Disclaimer: This article is for informational purposes only and does not constitute financial advice. Always conduct your own research (DYOR).


