
Key Takeaways 2017: Mainstream attention deepened the correction to approximately 84%. 2021: Institutional entry compressed the drawdown to roughly 77%. […]
The post From Peak to Bottom: How Far Has Bitcoin Fallen in Every Market Cycle appeared first on Coindoo.
Key Takeaways
- 2017: Mainstream attention deepened the correction to approximately 84%.
- 2021: Institutional entry compressed the drawdown to roughly 77%.
- 2025: ETF approval and halving mechanics have rewritten the playbook.
- 2013: The longest bear market erased roughly 87% over 14 months.
The Four-Year Cycle: What Drives the Pattern
Bitcoin’s recurring boom and bust structure according to many are not random and are anchored to the halving, a programmatic event built into Bitcoin’s code that cuts the rate of new BTC issuance in half approximately every four years. Each halving reduces the daily supply entering the market, and historically that supply shock has taken between 12 and 18 months to fully translate into price appreciation, which is why cycle peaks have consistently arrived roughly a year to a year and a half after each halving event.
The 2012 halving preceded the 2013 peak. The 2016 halving preceded the 2017 peak. The 2020 halving preceded the 2021 peak. In each case the peak arrived within November or December, making the seasonal pattern one of the most consistent macro signals in Bitcoin’s history. The four-year rhythm also means bear markets have tended to bottom within a similar timeframe after each peak, before the next halving cycle begins rebuilding the supply shortage dynamic from scratch.


The First Major Crash
Bitcoin reached its all-time high within November 2013, briefly touching above $1,100 before sellers took control. What followed was the longest correction in Bitcoin’s measurable history, lasting approximately 14 months and erasing roughly 87% of peak value before price found its floor near $155.
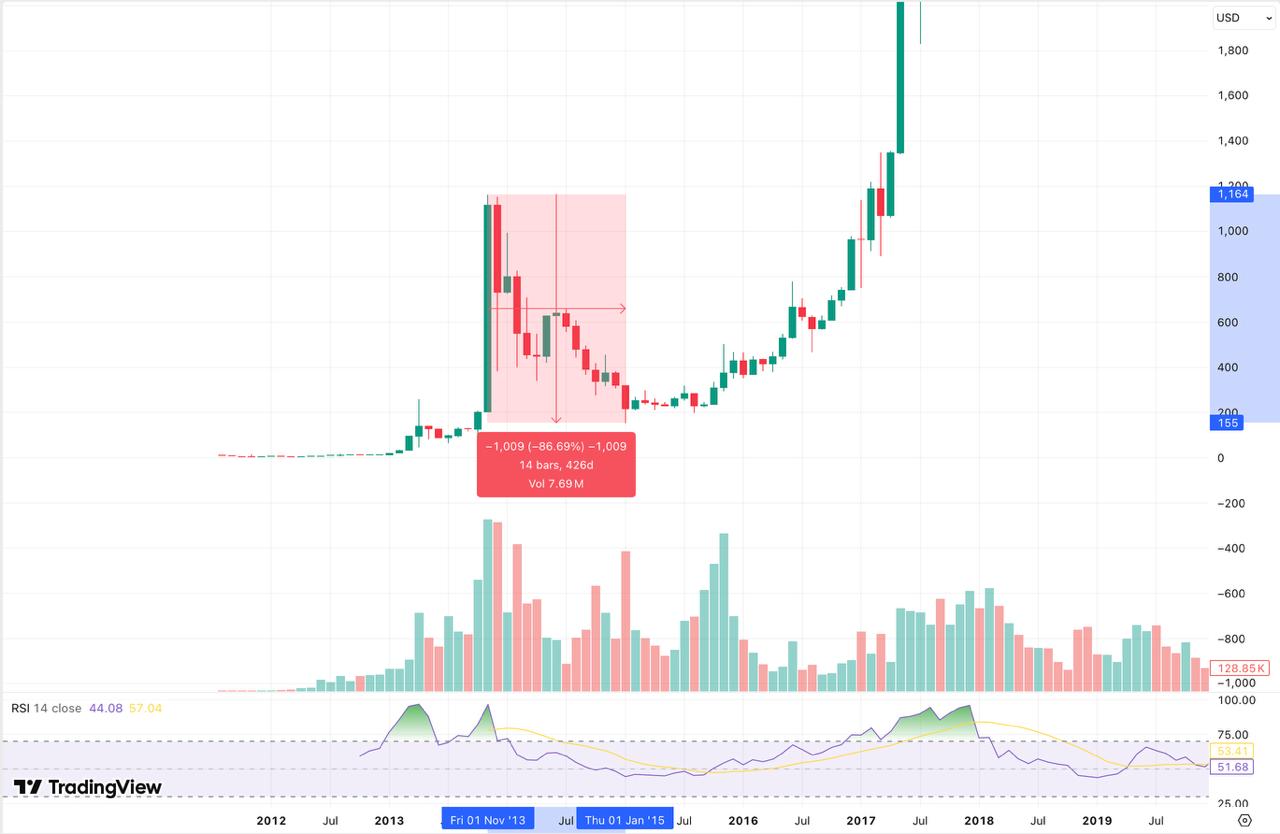
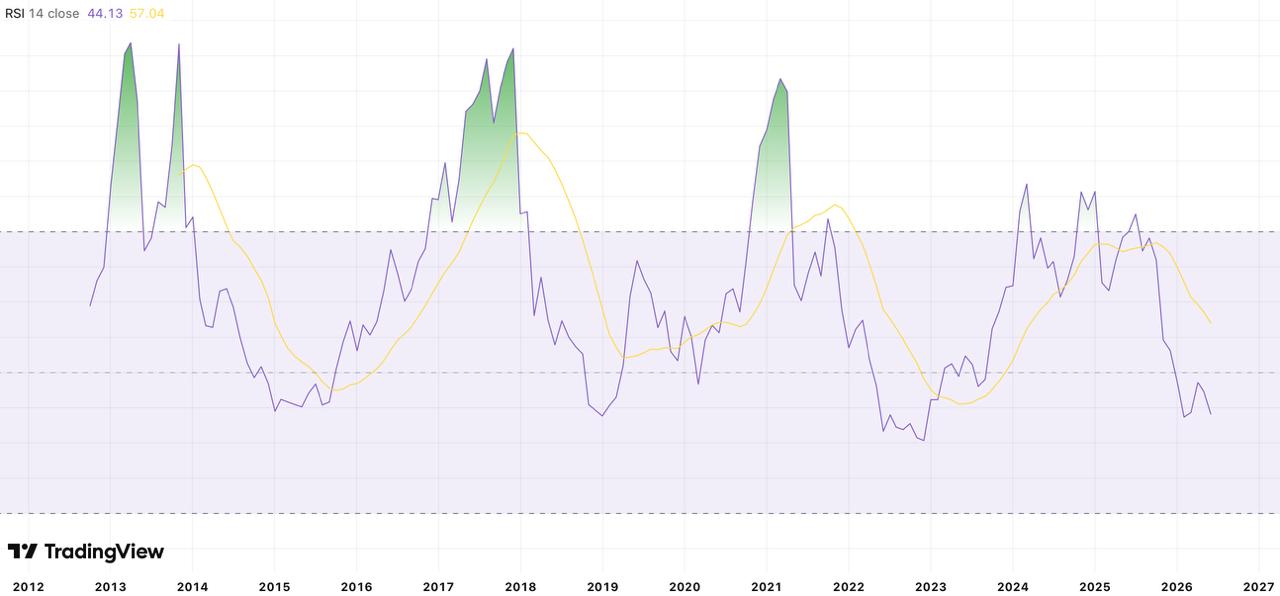
As shown in the historical RSI chart, the monthly RSI confirms the pattern that would repeat in subsequent cycles: spiking sharply into extreme overbought territory at the peak, then declining steadily through the correction phase before bottoming alongside price. The recovery from $155 was gradual, spending years rebuilding before the next cycle began in earnest.
The One That Put Bitcoin on the Map
Bitcoin reached its all-time high within December 2017, printing near $19,647 on Bitstamp before beginning a correction that lasted approximately a year. The drawdown erased roughly 84% of peak value, with price eventually finding its floor near $3,162 within December 2018.
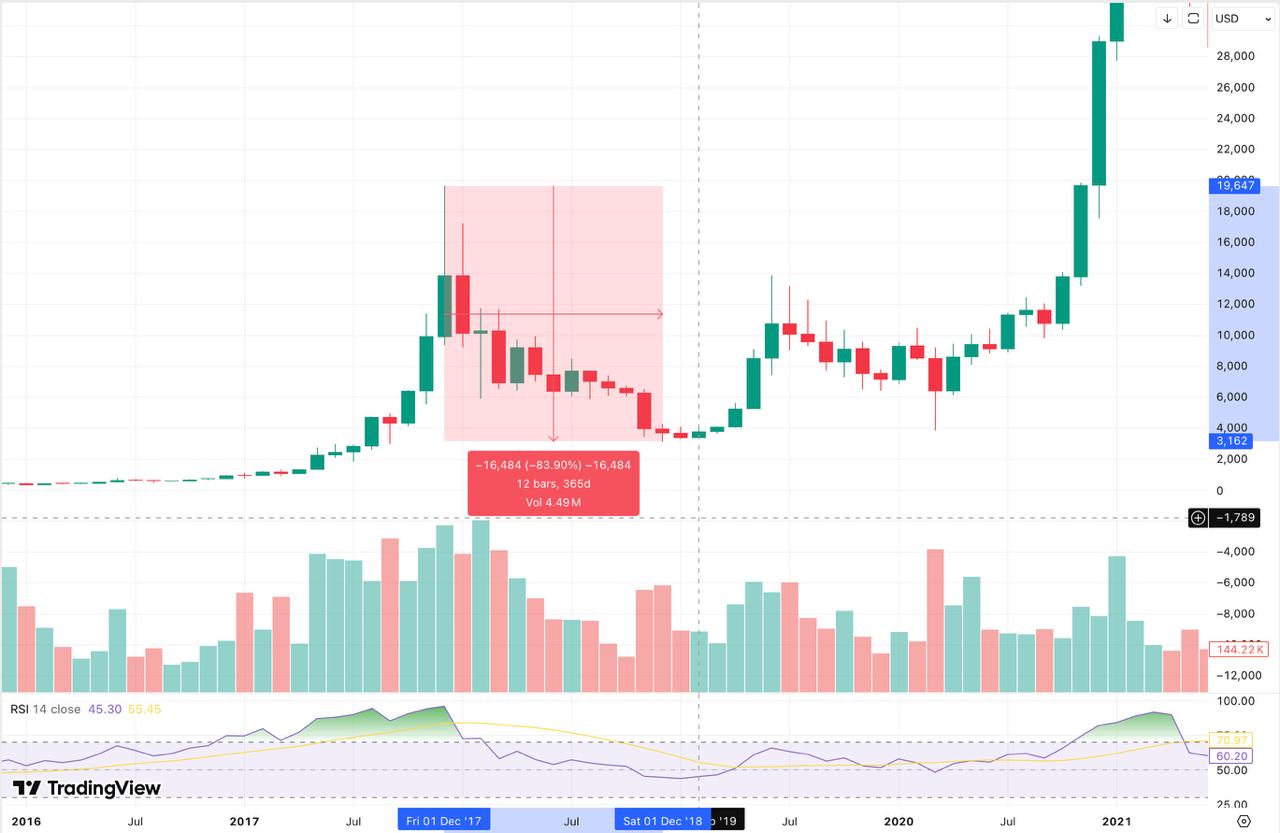
The RSI during this cycle followed the same architecture as 2013: a sharp overbought spike at the peak followed by a prolonged decline through the bear market. What differed was the starting price and the mainstream attention the cycle attracted, which arguably deepened the correction as latecomers who entered near the top became the primary source of sustained selling pressure throughout 2018. Bitcoin’s cycle peak arriving within December extended the November-December seasonal pattern for a second consecutive cycle.
The Institutional Cycle
Bitcoin reached its all-time high within November 2021, printing near $69,000 before beginning a correction that lasted approximately a year. The drawdown erased roughly 77% of peak value, with price bottoming near $15,548 within November 2022 before the recovery began.
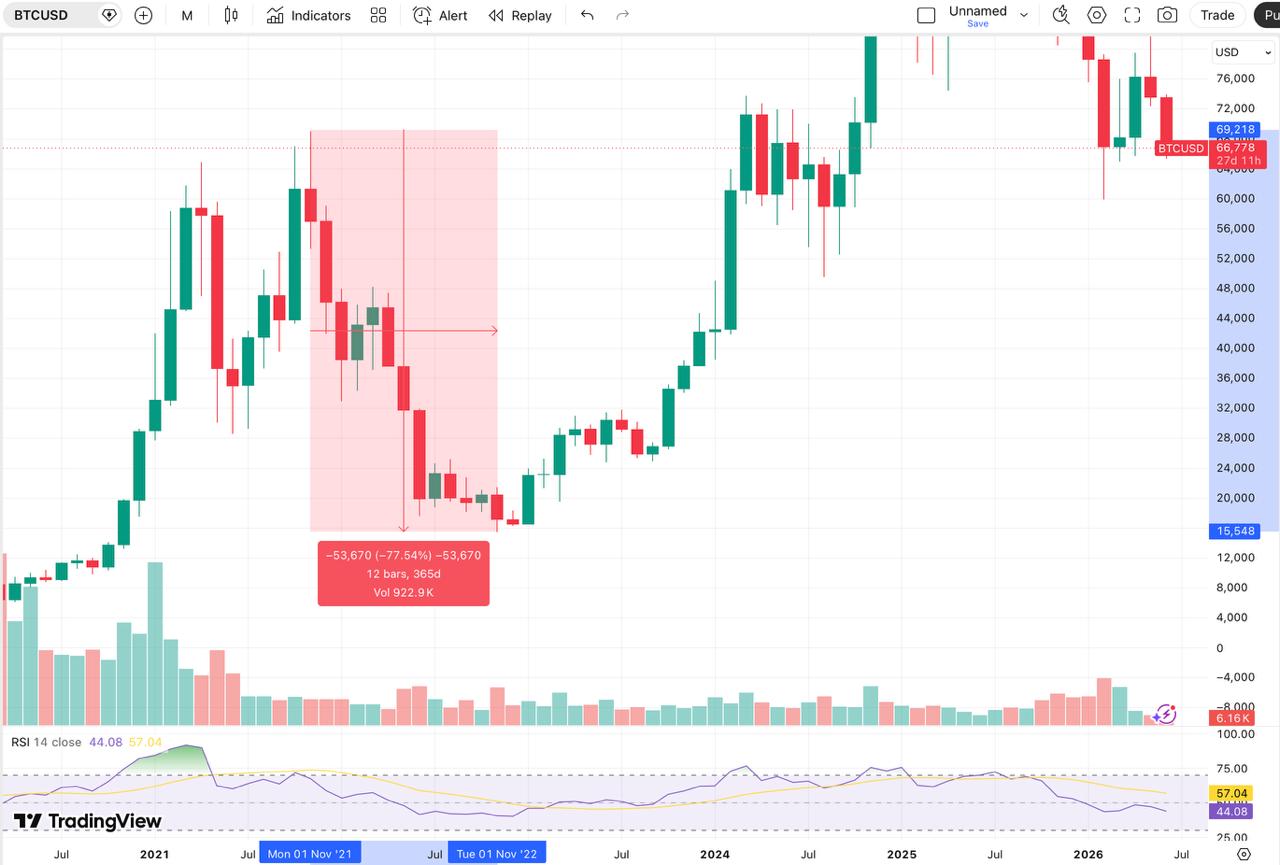
The 2021 cycle is notable for two structural reasons. The percentage drawdown was smaller than both previous cycles, approximately 77% versus 84% and 87%, suggesting that as Bitcoin’s market cap grows and institutional participation deepens, the severity of corrections may gradually compress. The RSI also bottomed at levels consistent with the two prior bear market floors, providing a cross-cycle confirmation signal that the 2022 low represented genuine exhaustion rather than a temporary pause in a deeper decline.
ETFs, an Earlier Peak, and an Open Question
The 2025 cycle introduced a structural variable that no previous cycle had: spot Bitcoin ETFs. The U.S. Securities and Exchange Commission approved the first spot Bitcoin ETFs on January 10, 2024, with trading beginning the following day. That approval opened Bitcoin to a pool of institutional and retail capital that previously had no direct, regulated access to spot exposure, and the resulting demand brought forward the cycle’s price appreciation timeline in a way that had no historical precedent.
The ETF approval had an immediate price effect. Bitcoin reached a new all-time high of approximately $73,750 within March 2024, breaking its previous record before the halving had even occurred. That move was structurally unusual: prior cycles had never produced a new all-time high before the halving, only after it. The March 2024 peak attracted relatively little mainstream attention precisely because it was only marginally above the previous cycle’s high, lacking the explosive percentage gains that had defined prior breakouts. But the timing alone was significant — it confirmed that ETF-driven institutional demand had decoupled Bitcoin’s price behavior from its historically predictable post-halving schedule, effectively breaking the cycle before the 2025 peak made that break undeniable.
For the first time, Bitcoin reached its all-time high within October 2025 rather than November or December, printing $126,200 on Bitstamp one month ahead of the established seasonal pattern, breaking a streak that had held across three consecutive cycles.
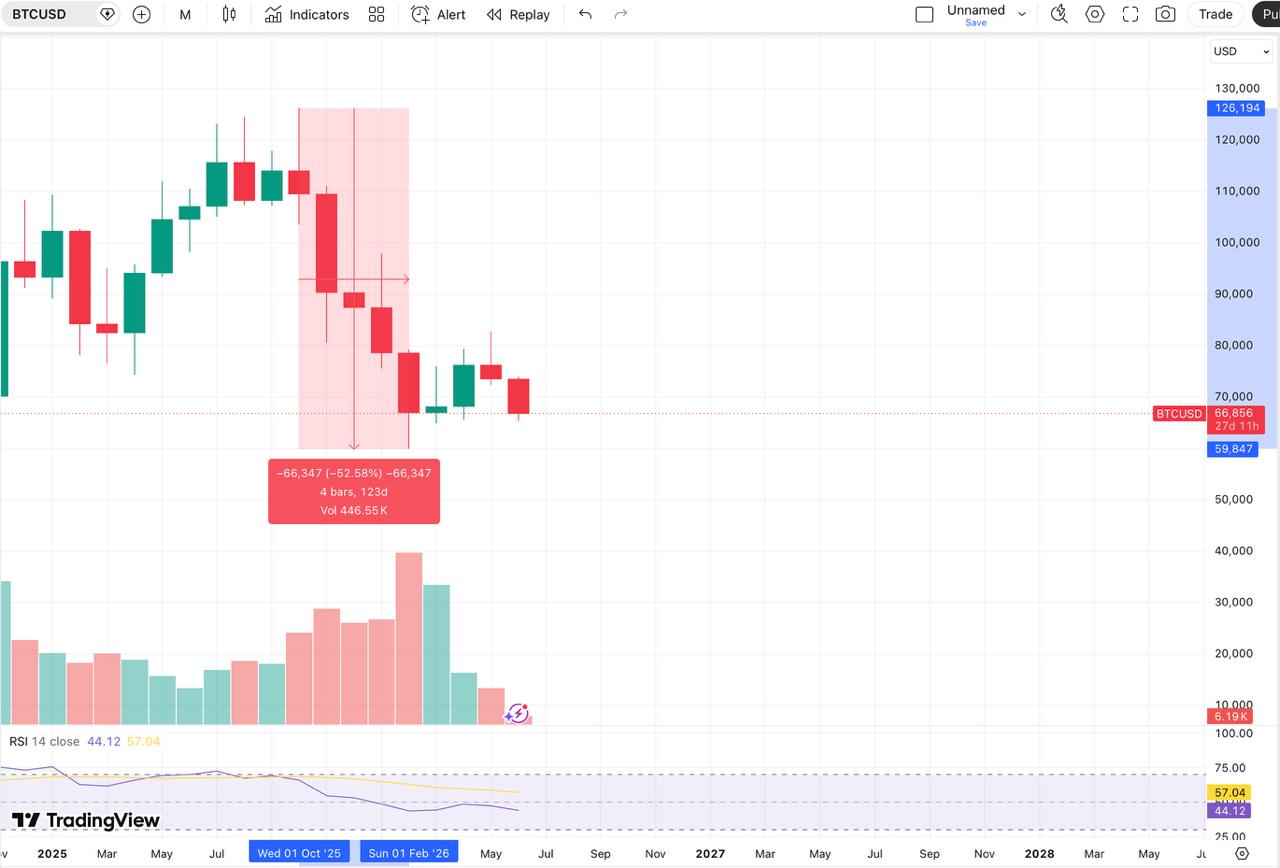
If the same logic applies to the downside, the ETF effect could also be pulling the cycle bottom earlier and keeping the percentage drawdown smaller than prior cycles. Sustained institutional buying through ETF products provides a demand floor that did not exist in 2018 or 2022, which could explain why the current correction, at approximately 50% from peak, remains shallower than the 77% to 87% drawdowns seen in previous cycles at comparable stages. Market data tracked by some analysts reinforces that view, noting that deep corrections following a major cycle high confirm the four-year model rather than disprove it.
However, the halving’s mechanical impact on price is structurally weakening over time. With over 95% (20.03M BTC out of 21M) of all Bitcoin already mined, the absolute reduction in newly issued supply during each halving creates a smaller economic shock than it did in earlier cycles, as Bitwise Chief Investment Officer Matt Hougan has noted.
Why is the four-year cycle dead?
1) The forces that have created prior four-year cycles are weaker:
i) The halving is half as important every four years;
ii) The interest rate cycle is positive for crypto, not negative (as it was in 2018 and 2022);
iii) Blow-up risk is… https://t.co/F9ybjHEeB5
— Matt Hougan (@Matt_Hougan) July 25, 2025
The four-year cycle is not disappearing, but it is evolving from a purely programmatic supply event into a broader macro-driven asset cycle shaped increasingly by institutional flows, regulatory developments, and global liquidity conditions.
From the October 2025 peak, Bitcoin dropped to the $59,000-$60,000 area before recovering toward current levels near $66,700 at the time of writing. Whether that level represents the confirmed cycle bottom or a temporary pause in a deeper correction remains genuinely unknown. The monthly RSI currently reads 44.13, not yet at the extreme oversold levels that accompanied confirmed bottoms in 2015, 2018, and 2022, which leaves the structural question open. The crypto market has a long history of producing outcomes that no historical model fully anticipated, and the current cycle, shaped by a regulatory shift of the magnitude of spot ETF approval, is no exception.
What the Pattern Tells Us
Across every completed cycle, three things have been consistent. The peak has arrived in the final months of the year, driven by the delayed supply impact of the halving. The correction has lasted approximately a year from peak to confirmed bottom. And the percentage drawdown has gradually compressed with each cycle as the asset matures and its holder base broadens.
The 2025 cycle has already broken the first rule by peaking in October rather than November or December. Whether it breaks the second and third remains to be seen. Crypto analyst Benjamin Cowen, who has tracked Bitcoin’s cyclical behavior across multiple market structures, argues that the four-year cycle has mutated rather than died, shifting from a purely supply-driven event into a macro-driven asset cycle. While the historic pattern faced unprecedented structural changes after the 2024 halving, Cowen suggests the broad market behavior continues to align with cyclical timelines, and if the cycle holds, points to around October as the timeframe for Bitcoin’s ultimate macro cycle low.
If the compression trend continues and institutional demand through ETF products provides the floor it did not in prior cycles, the current drawdown may resolve at levels shallower than history would suggest. If the RSI needs to reach the extreme readings that confirmed prior bear market floors, current readings at 44.13 indicate that point has not yet arrived.
For now, the data leaves the most important question unanswered. Whether the $60,000 area holds as the cycle bottom, earlier than any previous cycle has confirmed a floor, or gives way to a deeper move in the coming months is something no historical model can resolve with certainty. That answer will come from price action, not pattern recognition.
The information provided in this article is for educational purposes only and does not constitute financial, investment, or trading advice. Coindoo.com does not endorse or recommend any specific investment strategy or cryptocurrency. Always conduct your own research and consult with a licensed financial advisor before making any investment decisions.
The post From Peak to Bottom: How Far Has Bitcoin Fallen in Every Market Cycle appeared first on Coindoo.
Source: https://coindoo.com/from-peak-to-bottom-how-far-has-bitcoin-fallen-in-every-market-cycle/
More Crypto News
Check our Market Overview
Disclaimer: This article is for informational purposes only and does not constitute financial advice. Always conduct your own research (DYOR).

