
Key Takeaways INJ gained about 20% in 24 hours. Most weekly progress arrived in one session. Solana access created a […]
The post Injective Price Surges 20% Into Potential Double-Top Zone appeared first on Coindoo.
Key Takeaways
- INJ gained about 20% in 24 hours.
- Most weekly progress arrived in one session.
- Solana access created a fresh project catalyst.
- Futures turnover ran well above spot activity.
- A double top remains only a possibility.
INJ returns to the level that ended its May rally
Injective traded near $7.11 on September 19 after rising approximately 20% over 24 hours and 21% over seven days, according to CoinMarketCap data. Its market capitalization reached roughly $710 million.
The similarity between the two performance figures shows that most of the weekly gain arrived during the latest session. Rather than completing a gradual seven-day advance, INJ moved rapidly from the mid-$5 range and approached its highest price since late May.
On the Coinbase INJ/USD daily chart, the rally reached approximately $7.14 by 06:30 UTC. The late-May peak sits slightly higher, around $7.30-$7.40.

That zone stopped the previous advance and preceded a decline toward $4 in August. Returning to it after four months gives buyers a chance to establish a higher high, while another rejection would leave two prominent peaks at similar prices.
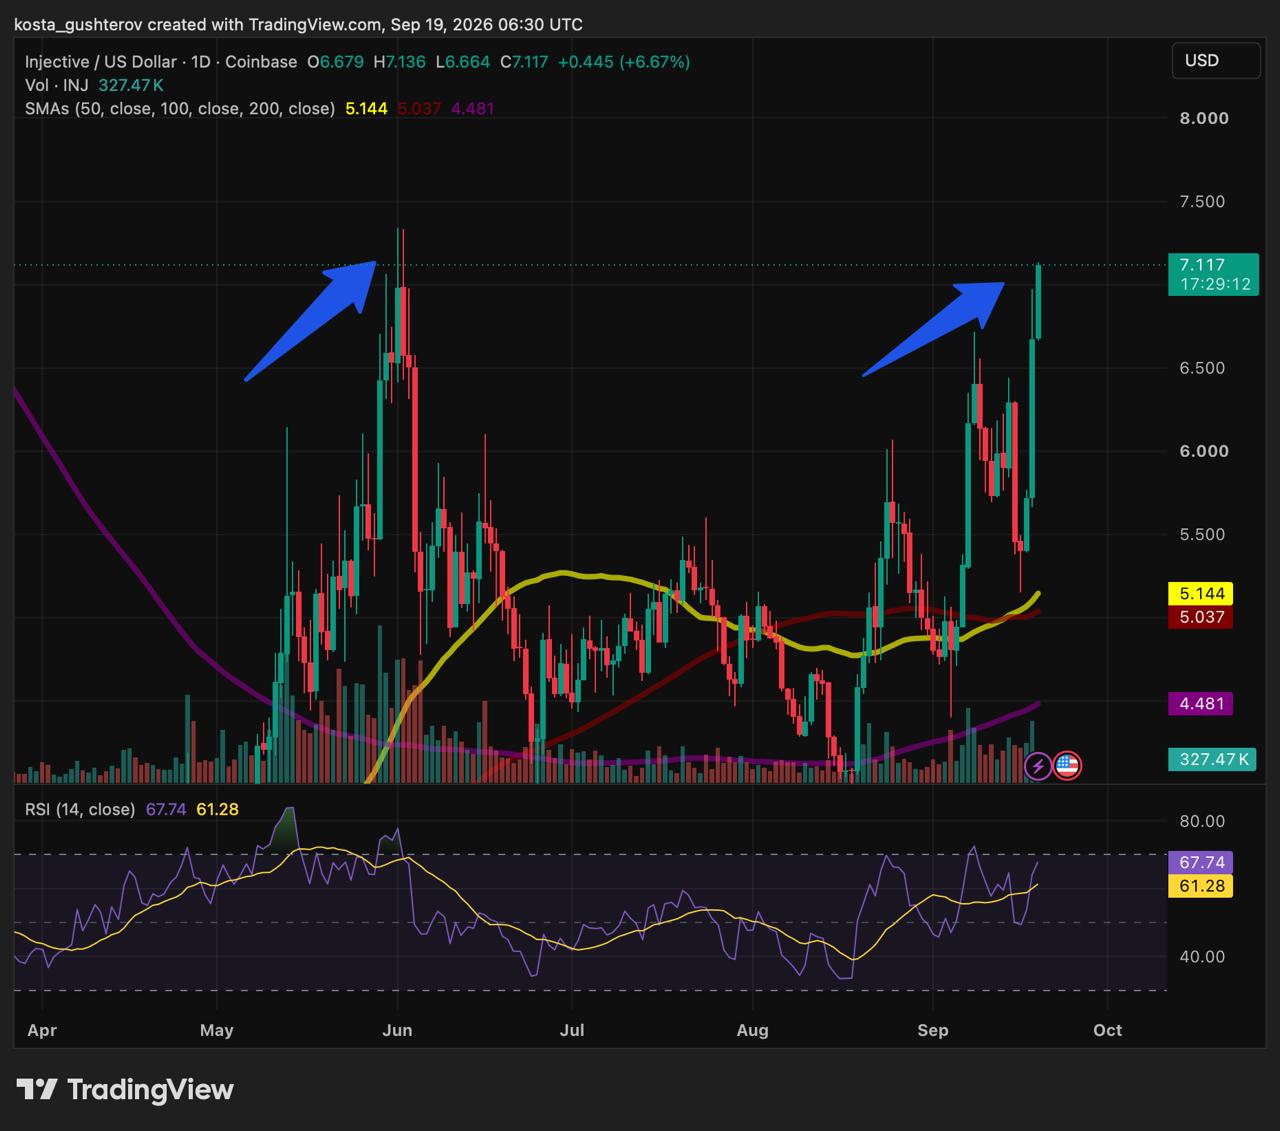
Momentum supports the latest attempt but also shows how quickly the price has moved. Daily RSI reached approximately 68, just below the conventional overbought threshold of 70. INJ was also trading around 38% above its 50-day moving average near $5.14.
A second peak would not complete the double top
A double top is a bearish reversal pattern in which price reaches a similar high twice, with a substantial decline between the two attempts. Traders read the structure as evidence that buyers were unable to absorb the supply waiting at the first peak.
Injective already has the first two components: the May high near $7.30-$7.40 and the August trough around $4.00-$4.10. The current rally is testing whether a second peak will form.
A rejection near $7.30 would create the outline of the pattern, but confirmation would normally require a later break below the intervening trough, known as the neckline. With INJ still trading above $7, the neckline remains more than 40% below the market.
This leaves a wide range between an ordinary rejection and a confirmed reversal. INJ could pull back from $7.30, establish a higher low and make another breakout attempt without completing the bearish pattern.
Solana access gave traders a new reason to watch INJ
The price move followed Injective’s September 17 announcement that INJ had become available on Solana through Sunrise. Initial liquidity went live on Raydium, while StonkFun added INJ as a supported base pair.
The expansion allows Solana users to access INJ through wallets and applications they already use, including Phantom. It also places the token inside a larger trading environment without requiring those users to begin on Injective’s own network.
Several additional Solana integrations mentioned in the announcement were described as planned or potential additions. They should not be counted as active services until their launches are confirmed.
INJ was not rising alone. Capital was already spreading across decentralized finance, scaling networks and other higher-risk assets, although the longer 90-day data still shows why the market has not entered a confirmed altseason.
The September 17 launch therefore arrived in favorable market conditions and gave the broader rotation an INJ-specific focus. Market data cannot isolate how much buying came directly from the Solana expansion, but the timing makes it a credible part of the rally’s context.
Futures trading helped accelerate the move
CoinGlass recorded approximately $409 million in INJ futures turnover over 24 hours, compared with about $71 million in tracked spot volume. Futures activity was therefore around six times the reported spot figure.
Open interest stood near $160 million, while recorded liquidations totaled approximately $470,000. The data confirms heavy use of leveraged products but does not provide enough detail to classify the advance as a short squeeze.
This can affect INJ in both directions. If rising prices force short sellers to close positions, their buy orders can add momentum to the rally. However, if INJ stalls near $7.30 and leveraged longs begin exiting, liquidations can add forced selling and deepen the pullback. With futures turnover far above tracked spot volume, the move may remain volatile unless spot buyers absorb those orders.

Four areas define the next chart decision
$7.30-$7.40: May resistance
A daily close above this zone would give INJ a higher high and weaken the potential double top. Holding above it during a later pullback would provide stronger evidence that the market had accepted the breakout.
$6.50-$6.70: First pullback test
This area contains the latest breakout and offers the closest test of whether buyers will defend the advance. A rejection at $7.30 followed by support here would leave the wider recovery intact.
$5.00-$5.15: Moving-average support
The 50- and 100-day moving averages are clustered in this region. A retreat toward them would erase much of the latest surge but would still leave INJ above its August low.
$4.00-$4.10: Double-top neckline
This is the August trough separating the two potential peaks. Only a breakdown through this area would confirm the classical reversal pattern suggested by the May and September highs.
The first pullback might reveal more than the first rejection
Sellers stopped the May rally around $7.30, and they may defend the same area again. A second rejection would be notable, but it would provide little information by itself after a one-day gain of approximately 20%.
The more useful signal will be where buyers return. Support above $6.50 would show that INJ is building a higher trading range despite failing to break out immediately. A retreat toward $5 would suggest that the Solana launch and leveraged activity produced a sharp repricing without establishing firm support near the high.
Injective enters this test with wider distribution than it had in May and with the broader altcoin market moving in its favor. Whether those changes are enough to alter the chart will become clearer after the initial momentum fades.
This article is provided for informational purposes only and does not constitute financial or investment advice. Cryptocurrency prices, technical indicators and derivatives data can change rapidly.
The post Injective Price Surges 20% Into Potential Double-Top Zone appeared first on Coindoo.
Source: https://coindoo.com/injective-price-surges-20-into-potential-double-top-zone/


More Crypto News
Check our Market Overview
Disclaimer: This article is for informational purposes only and does not constitute financial advice. Always conduct your own research (DYOR).