

Key Takeaways ETH has fallen below its short rising daily trendline. $2,535-$2,580 combines a daily Fibonacci level, the 50-day SMA […]
The post Ethereum Price Drops Below Its Trendline: Why $2,550 Support Matters appeared first on Coindoo.
Key Takeaways
- ETH has fallen below its short rising daily trendline.
- $2,535-$2,580 combines a daily Fibonacci level, the 50-day SMA and the 200-week SMA.
- The weekly 0.236 Fibonacci level near $2,500 is the next support below that area.
- $2,760 and $2,800 remain the main levels buyers need to recover.
ETH has reached the area buyers need to defend
At 13:24 UTC on October 7, ETH traded near $2,559 on Bitstamp’s TradingView chart after falling below the short rising trendline that supported its advance through September – down about 5.5% over the preceding 24 hours.
The decline followed several failed attempts to establish price above $2,800. ETH repeatedly reached that area in late September, only to fall back into its earlier range. With the daily diagonal now broken, buyers need to show that the wider recovery can withstand a deeper pullback.
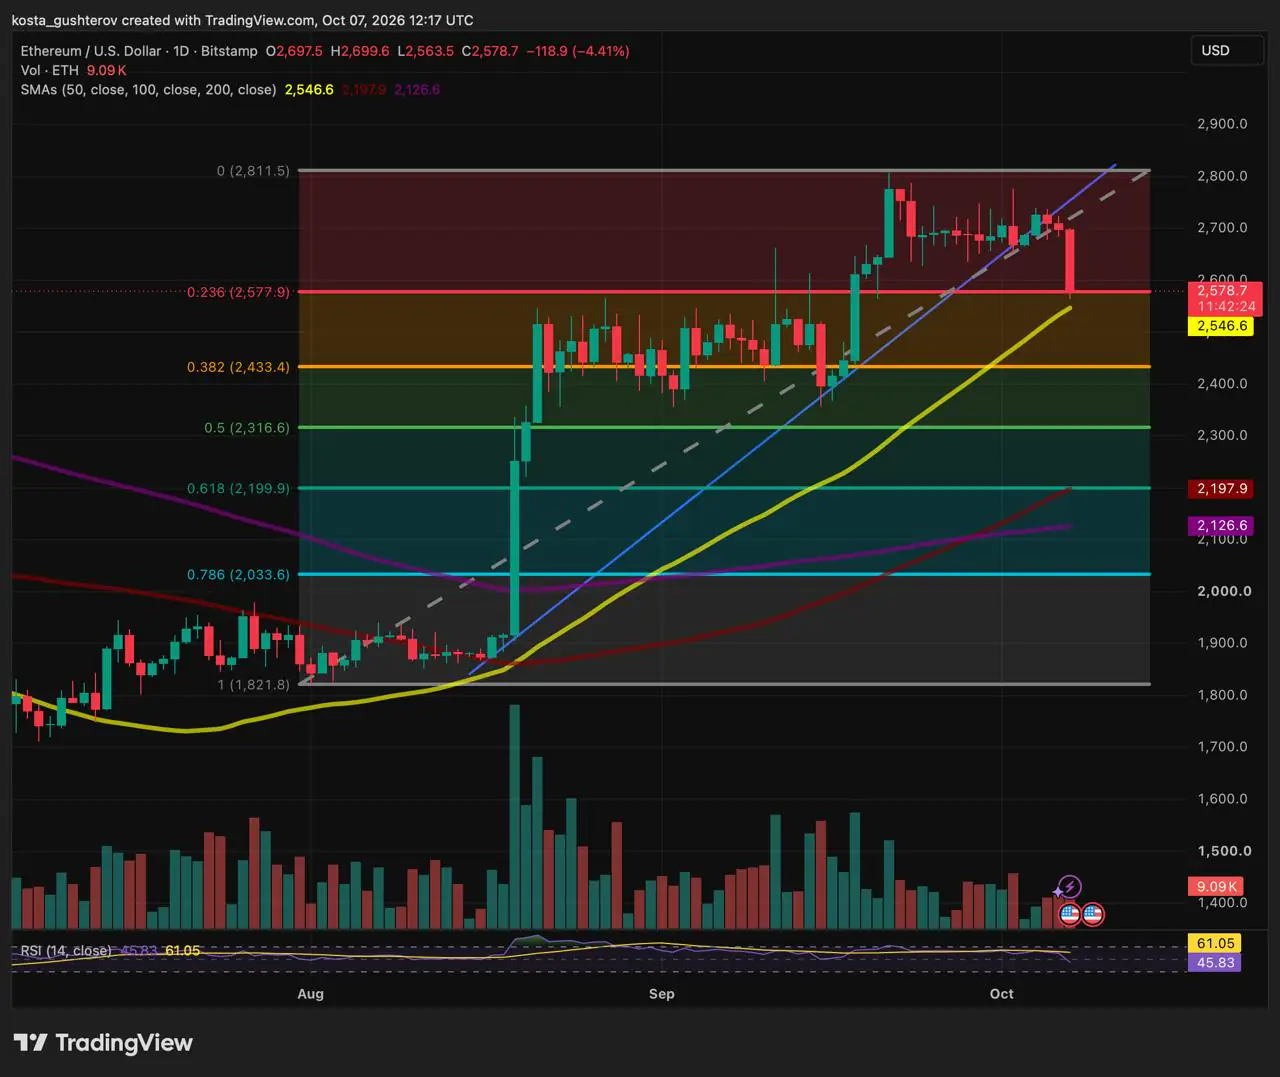
The immediate response is forming between $2,535 and $2,580. The daily 0.236 Fibonacci retracement sits near $2,560, while the 50-day SMA runs close to $2,547. The 200-week SMA near $2,540 adds a longer-term reference just below them.


A brief move through one part of the zone would not decide the setup while the daily candle remains open. A close below $2,535, followed by a failed recovery, would bring the weekly Fibonacci level near $2,500 into view. Losing that level would expose the daily 0.382 retracement around $2,430 and confirm that the pullback has moved beyond the broken diagonal.
The weekly chart widens the support range
The revised weekly Fibonacci measurement places its 0.236 retracement near $2,500. Together with the 200-week SMA near $2,540, it creates a broader weekly support band beneath the daily levels rather than one exact floor.
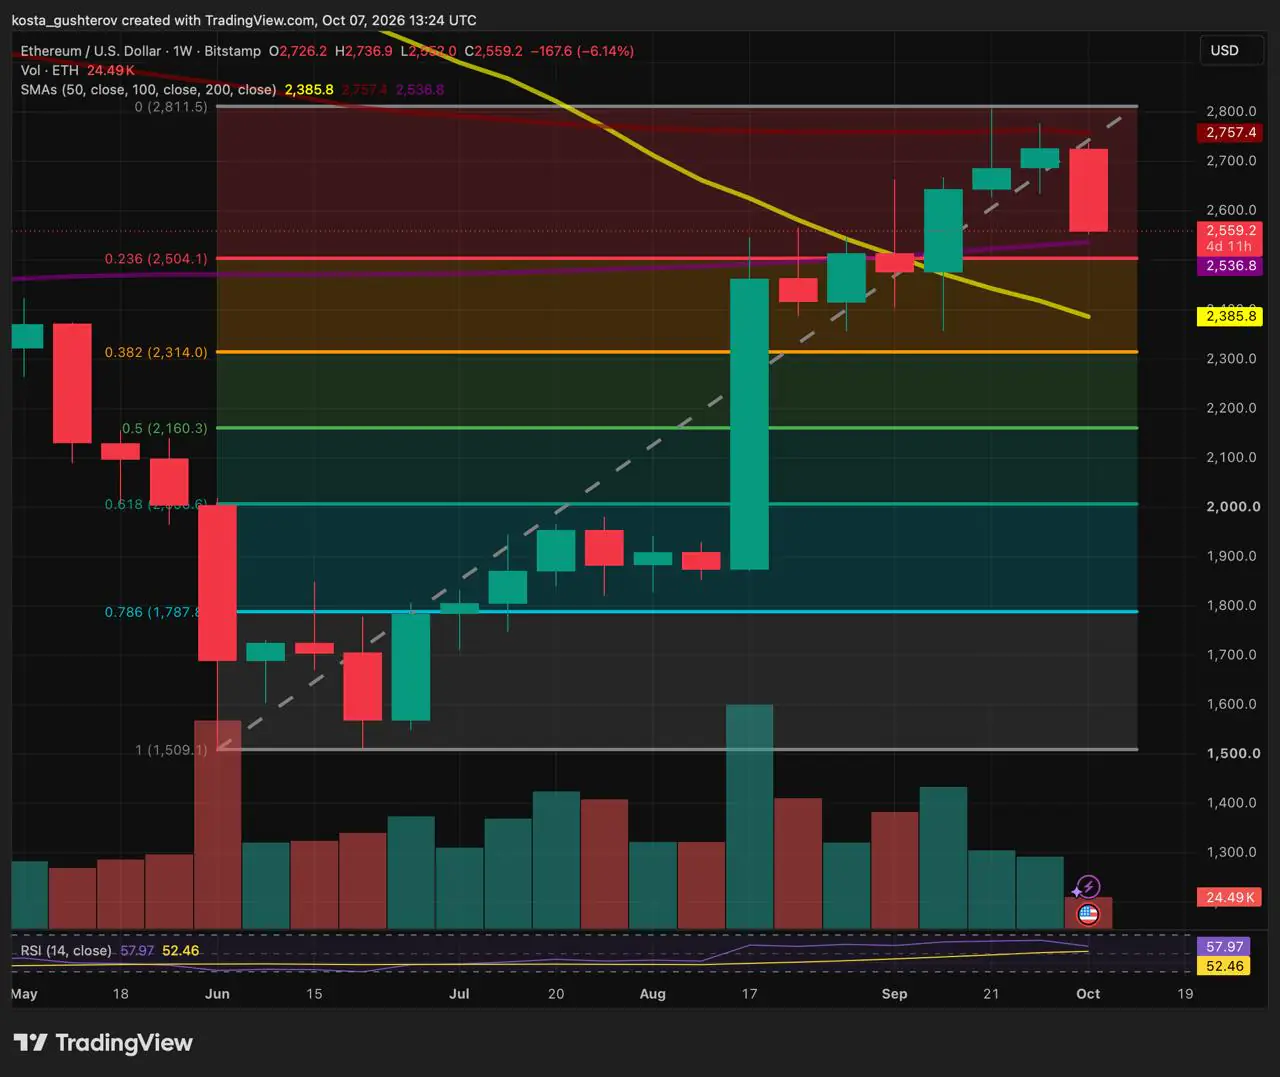
ETH has arrived at daily support, while the weekly chart leaves room for a deeper decline toward $2,500 without breaking its entire recovery structure. Holding above the 200-week average would offer the firmer early sign that buyers remain active; a drop through it would shift attention to the Fibonacci level beneath.
Resistance remains close enough to shape any rebound. The 100-week SMA near $2,760 has capped recent advances, while $2,800-$2,812 contains the latest high. ETH would need to recover both areas before the market could treat the decline as a completed pullback rather than another failed attempt to clear resistance.
Below $2,500, the daily 0.382 Fibonacci level near $2,430 comes into view. The 50-week SMA near $2,390 would become more relevant only if selling extends beyond that daily support.
BitMine may leave the market needing another buyer
The support test is taking place while one of Ether’s most visible corporate accumulators appears close to completing its strategy. CoinDesk reported that BitMine chairman Tom Lee said the company plans to stop token purchases after nearing its goal of holding 5% of ETH’s supply.
BitMine’s October 5 release shows why the comment has drawn attention. The company reported holding 6,016,414 ETH, equal to 4.9% of the stated 122.1 million ETH supply, and said it had bought Ether every week since beginning its treasury strategy in June 2025. The company’s SEC-filed release confirms the scale of those holdings, though it does not disclose the timing, venue or market effect of individual purchases.
Ending purchases would leave BitMine with its existing ETH position while reducing a recurring source of disclosed demand. ETF flows, spot buyers, stakers and other treasury companies would then have a larger role in determining whether ETH can hold its support range.
Futures positioning could make the response sharper. ETH entered the sell-off with elevated derivatives activity, and the next change in open interest may show whether traders are closing leverage or opening fresh positions. Ethereum’s recent eight-month open-interest high and the rise in Bitfinex shorts show why price alone does not reveal the full balance of risk around a key level.

The support reaction now carries the story
ETH has moved from rejection at $2,800 into daily support, with a wider weekly band extending toward $2,500. Holding above the 200-week SMA near $2,540 would keep the recovery on firmer ground, although buyers would still need to reclaim $2,760 and then $2,800 to change the near-term picture.
A sustained loss of $2,500 would put $2,430 in focus and make the question of replacement demand more pressing. BitMine’s reported plan does not prove why Ether fell today. It does make the response at support more revealing, because the market may soon need to hold without one of its most consistent disclosed buyers.
This article is for informational purposes only and does not constitute investment or trading advice. Technical levels are approximate and do not guarantee future price movements.
The post Ethereum Price Drops Below Its Trendline: Why $2,550 Support Matters appeared first on Coindoo.
Source: https://coindoo.com/ethereum-price-drops-below-trendline/


More Crypto News
Check our Market Overview
Disclaimer: This article is for informational purposes only and does not constitute financial advice. Always conduct your own research (DYOR).