Key Takeaways 1Bounce to $1 faded, price near $0.94 2Channel floor sits between $0.85 and $0.90 3A bounce faces $1, […]
The post XRP Price Is 4% From a Line That Has Held Since 2020 appeared first on Coindoo.
Key Takeaways
Coindoo’s November 11 XRP analysis laid out a path from $0.99 down to a weekly support band. The first step of that path is done, and the weekly chart now shows what the second step would test.
Nine Days, One Lost Floor
The daily level failed first. Once $0.99 went, the next reference was the weekly band the earlier piece had already marked, and nothing in between has slowed the decline.


This week’s candle shows how the old floor now behaves. XRP opened the week near $0.97, reached $1.0066 and then fell back. With two and a half days left in the candle when the chart was captured, it was trading at $0.9382, down 3.65% on the week and close to its low of $0.9323. Buyers did not hold $1 even once on the way back up. That makes $1 the first ceiling any rebound would have to clear, where it used to be a floor.
Bitcoin Set the Pace
XRP’s slide has tracked Bitcoin’s. On November 19, Bitcoin fell to $61,800, its lowest price since early July, as a stock selloff deepened into the close and the Nasdaq and Dow each lost 2.1%, CoinDesk reported. That put Bitcoin on track for a seventh straight weekly loss, and XRP stayed under $1 through the session. Bitcoin has since retested $61,500, the zone it lost in June. With the market leader still making new lows, XRP’s supports are being tested by market-wide selling, not by anything specific to XRP.
Zooming Out to the Six-Year Channel
The November 11 piece counted the rising trendline from the 2020 lows as one of four supports. On the weekly chart, that trendline is the lower rail of a full channel, and the rest of the channel adds context.
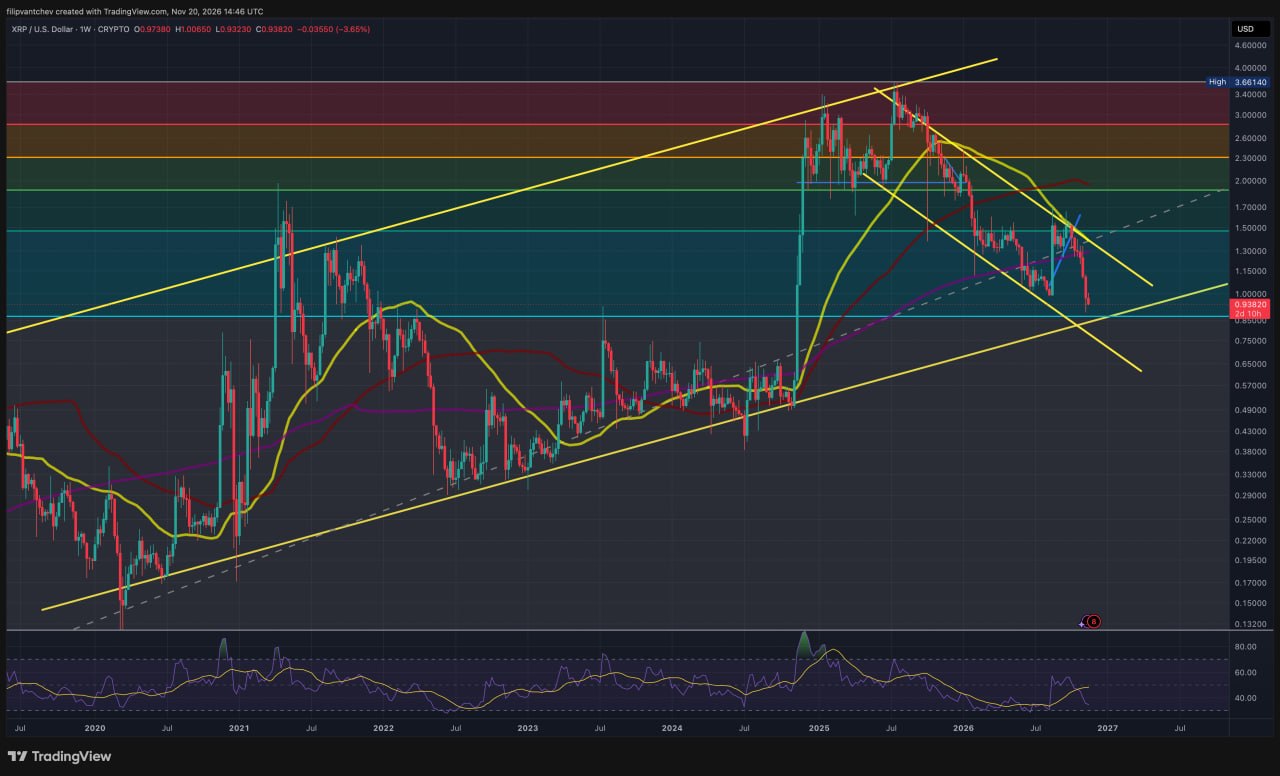
The lower rail caught XRP’s lows in 2020, 2022, 2023 and 2024, and the November 2024 breakout started from it. The upper rail touched the late-2021 highs and capped the 2025 run at the $3.66 peak. XRP spent most of 2025 in the upper half of that range. Since the peak, it has fallen inside a smaller descending channel. It lost the dashed midline of the larger channel, and the August–October rebound briefly lifted it back above that midline. The rebound stalled at the descending channel’s upper rail and the falling 50-week average, above $1.50, and price has dropped from there into this week.
The descending channel’s lower rail meets the six-year channel’s lower rail close to the same $0.85-$0.90 zone. If XRP gets there, both structures will be tested at once.
What Still Works Against a Rebound
All three weekly averages sit above price. The 50-week, near $1.41 at the November 11 reading, is clearly sloping down. The 200-week, near $1.28, has flattened. The 100-week, near $1.96, has started to turn lower. A rebound from the channel floor would run into all three on the way up.
Momentum hasn’t turned either. Weekly RSI is in the lower part of its range and below its own moving average. The August bounce lifted it above that average, but the reading has fallen back since then and shows no upturn yet. The shaded bands on the chart are the Fibonacci levels from the earlier article, and the lowest of them, near $0.87, sits inside the channel-floor zone.
Distance from $0.94
Two Ways the Weekly Closes Can Read
The upside range is wider than it looks. The 200-week average near $1.28 sits inside it, and the November 11 analysis treated any rebound that stalls below that line as a recovery within a downtrend. The top of the range, around $1.50, is roughly where the August–October bounce gave out, and the 0.618 retracement sits near $1.47. Reaching $1.15 would be a rebound. Holding above $1.28 would be the first change in the weekly structure.
The setup is awkward for both sides. Sellers have already taken XRP from above $1.50 to $0.94, and opening new shorts just above a six-year trendline means betting against a level that has stopped every major decline since 2020. Buying before a weekly candle confirms a hold means risking that this is the time the trendline breaks, with Bitcoin still printing new lows.
The Two Closes on the Calendar
Sunday’s candle will show whether this week ends at its lows or with a rejection wick off them. The monthly close will show where November finishes relative to a band that sat 15% below price when the month’s analysis began. Until a weekly candle closes inside or below the $0.85–$0.90 zone, the six-year channel has not been tested, only approached.
This article is market commentary based on chart analysis and is not investment advice. Crypto assets are volatile, and price levels can fail without warning.
The post XRP Price Is 4% From a Line That Has Held Since 2020 appeared first on Coindoo.
Source: https://coindoo.com/xrp-price-is-4-from-a-line-that-has-held-since-2020/


More Crypto News
Check our Market Overview
Disclaimer: This article is for informational purposes only and does not constitute financial advice. Always conduct your own research (DYOR).