
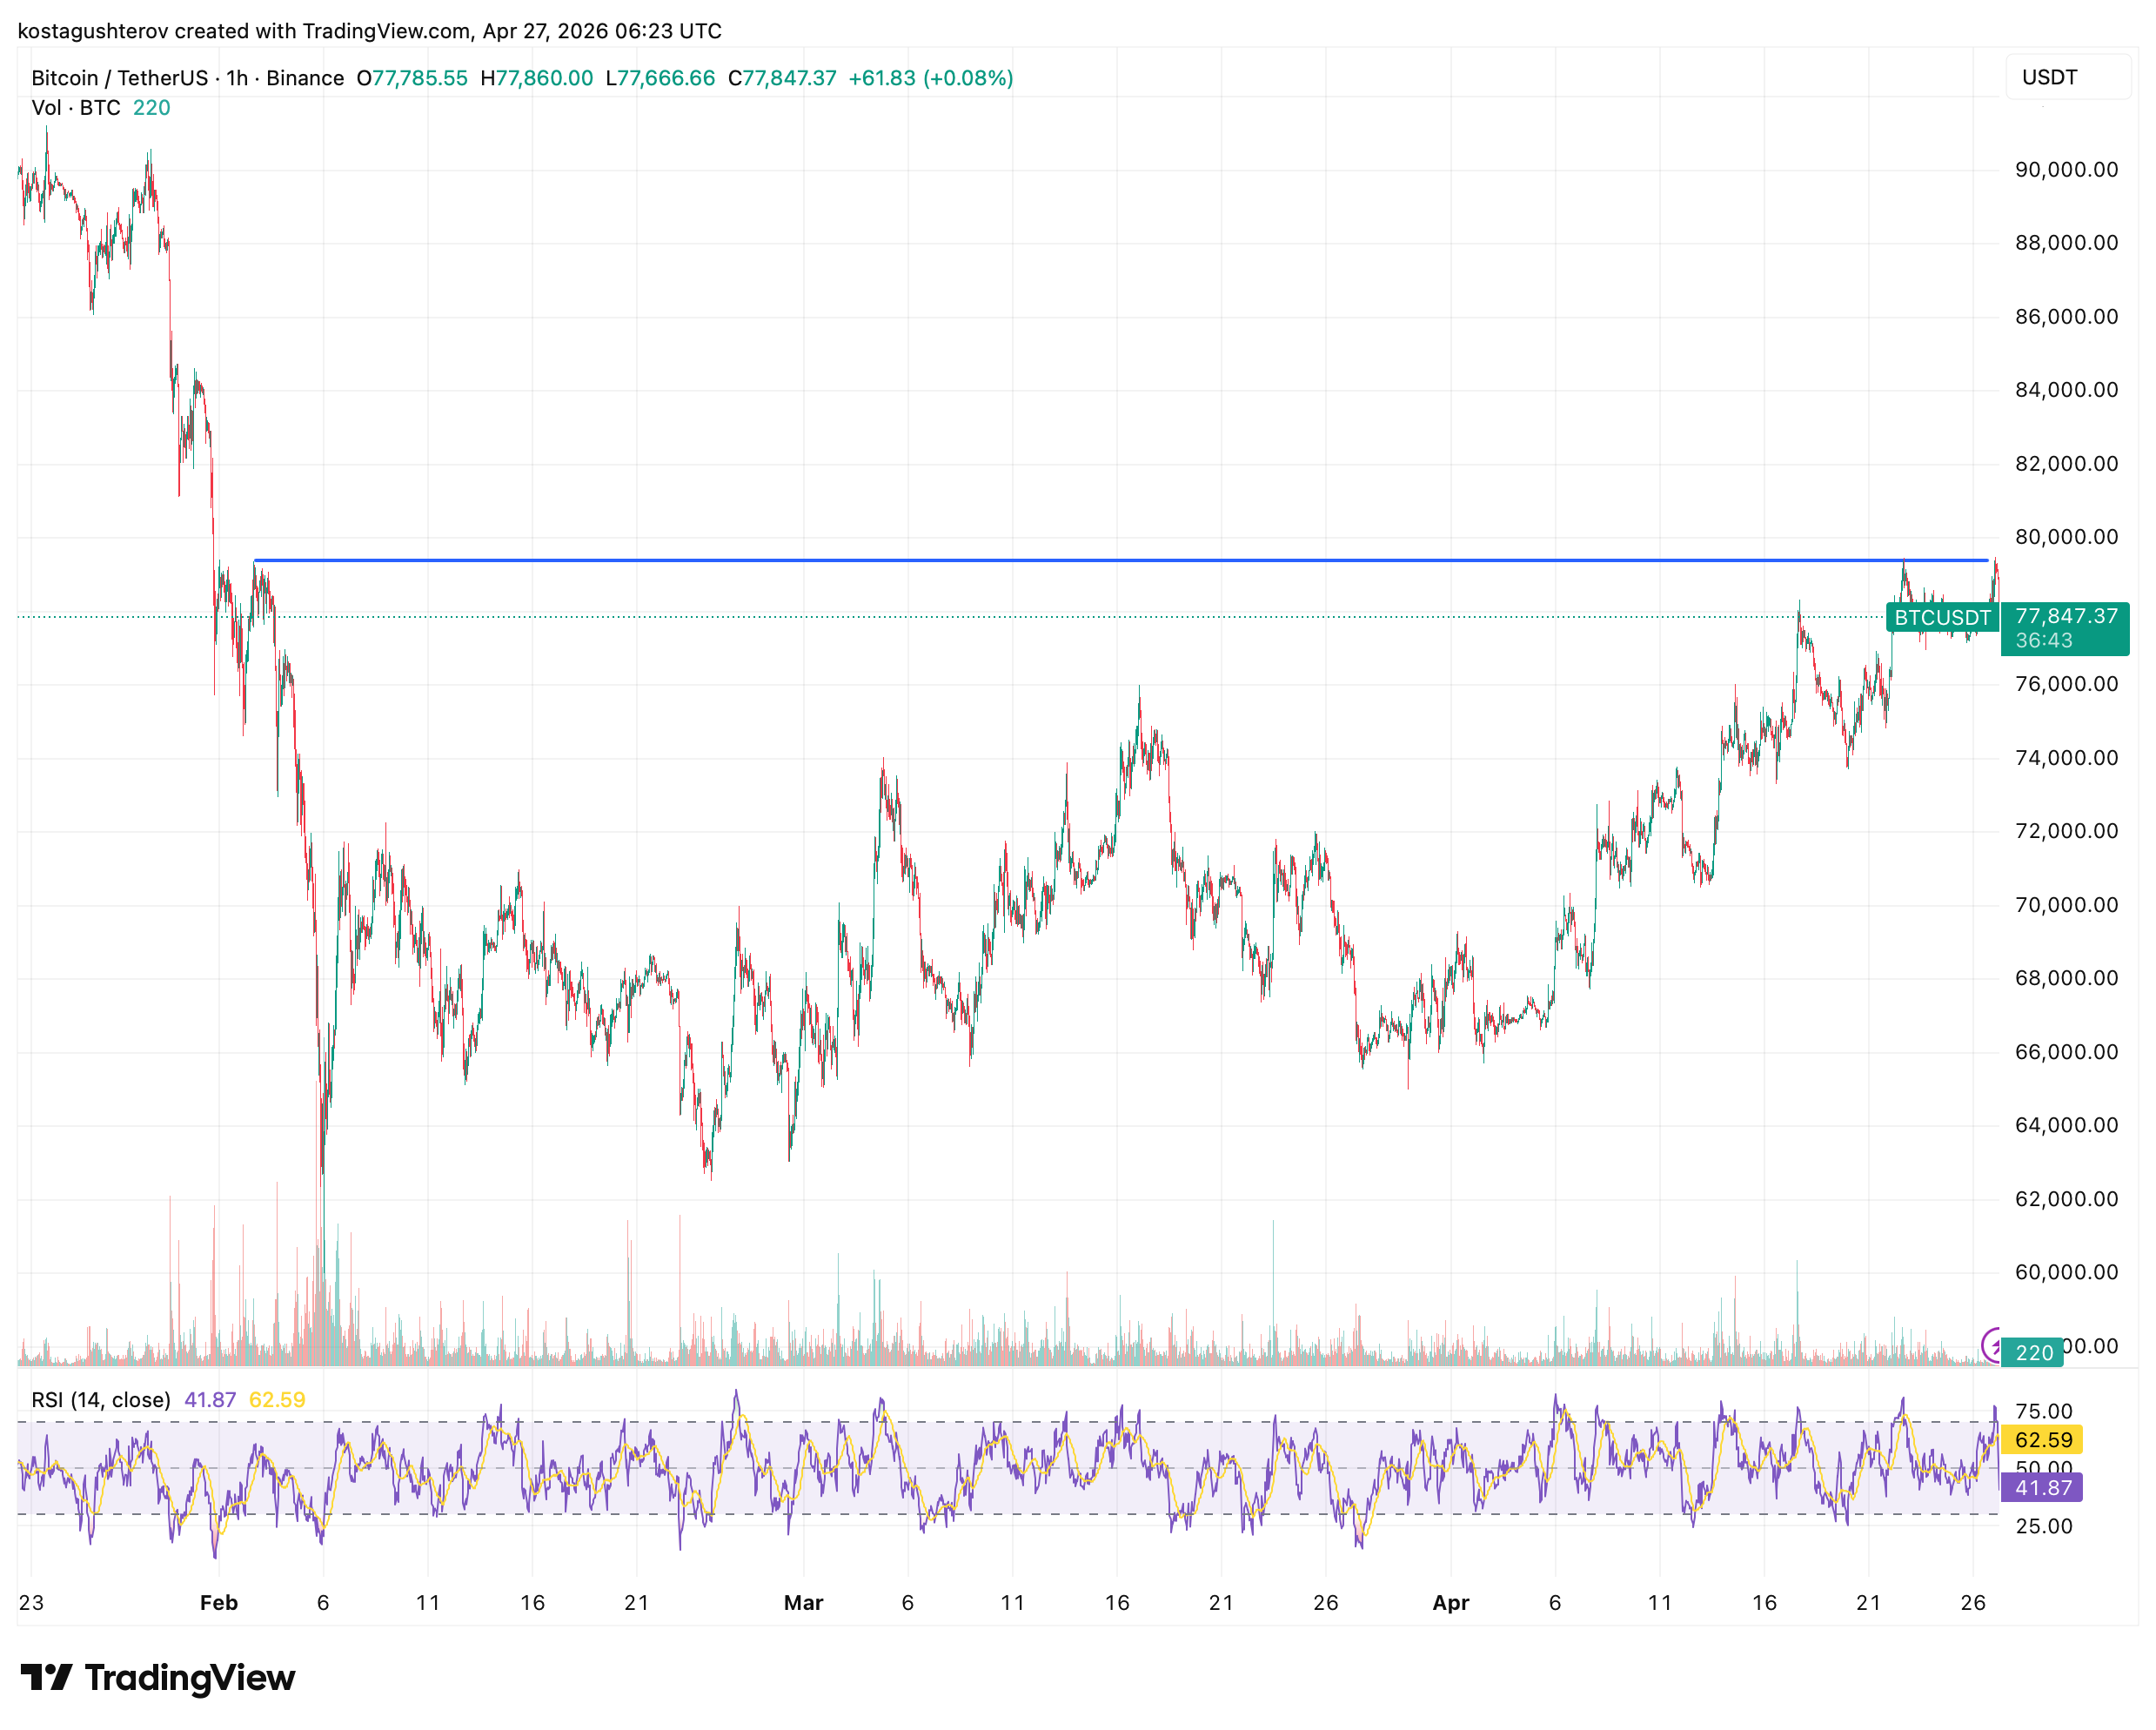
Key takeaways: BTC hit 12-week high of $79,488 on April 27, now at $77,700. Third rejection at $80,000. RSI collapsed […]
The post Bitcoin Touched $79,500 and Fell Back to $77,500: On-Chain Data Shows Why appeared first on Coindoo.
Key takeaways:
- BTC hit 12-week high of $79,488 on April 27, now at $77,700.
- Third rejection at $80,000.
- RSI collapsed from approximately 75 to 39.54 in a single candle.
- Rejection candle volume largest sell candle visible on the 1H chart.
- Price returned to prior range top at $77,700.
- RSI signal line at 62.43.
- FOMC rate decision April 29 – Powell’s final remarks before Warsh takes over May 15.
- Support: $78,500 immediate, $76,900 (200-EMA 1H), $75,000 critical floor.
- Daily close above $79,500 needed to open path toward $82,000-$83,850.
The first rejection at $80,000 can be explained as natural resistance. The second confirms sellers are positioned there. The third, at $79,488, the highest attempt yet, reveals something more specific: the demand required to absorb that supply is not currently present. The Coinbase Premium data shows exactly where it went.


The on-chain signal that explains why
The Coinbase Premium Index measures the price difference between Coinbase, the primary US institutional trading venue, and other global exchanges. When the premium is positive and rising, large-scale buyers are paying above the global price to acquire Bitcoin. When it falls, they are stepping back.
Between April 22 and April 27, the Coinbase Premium Index fell from 0.038 to 0.020, a 47% decline while price was attempting its highest levels in 12 weeks. The move to $79,488 happened without institutional support.
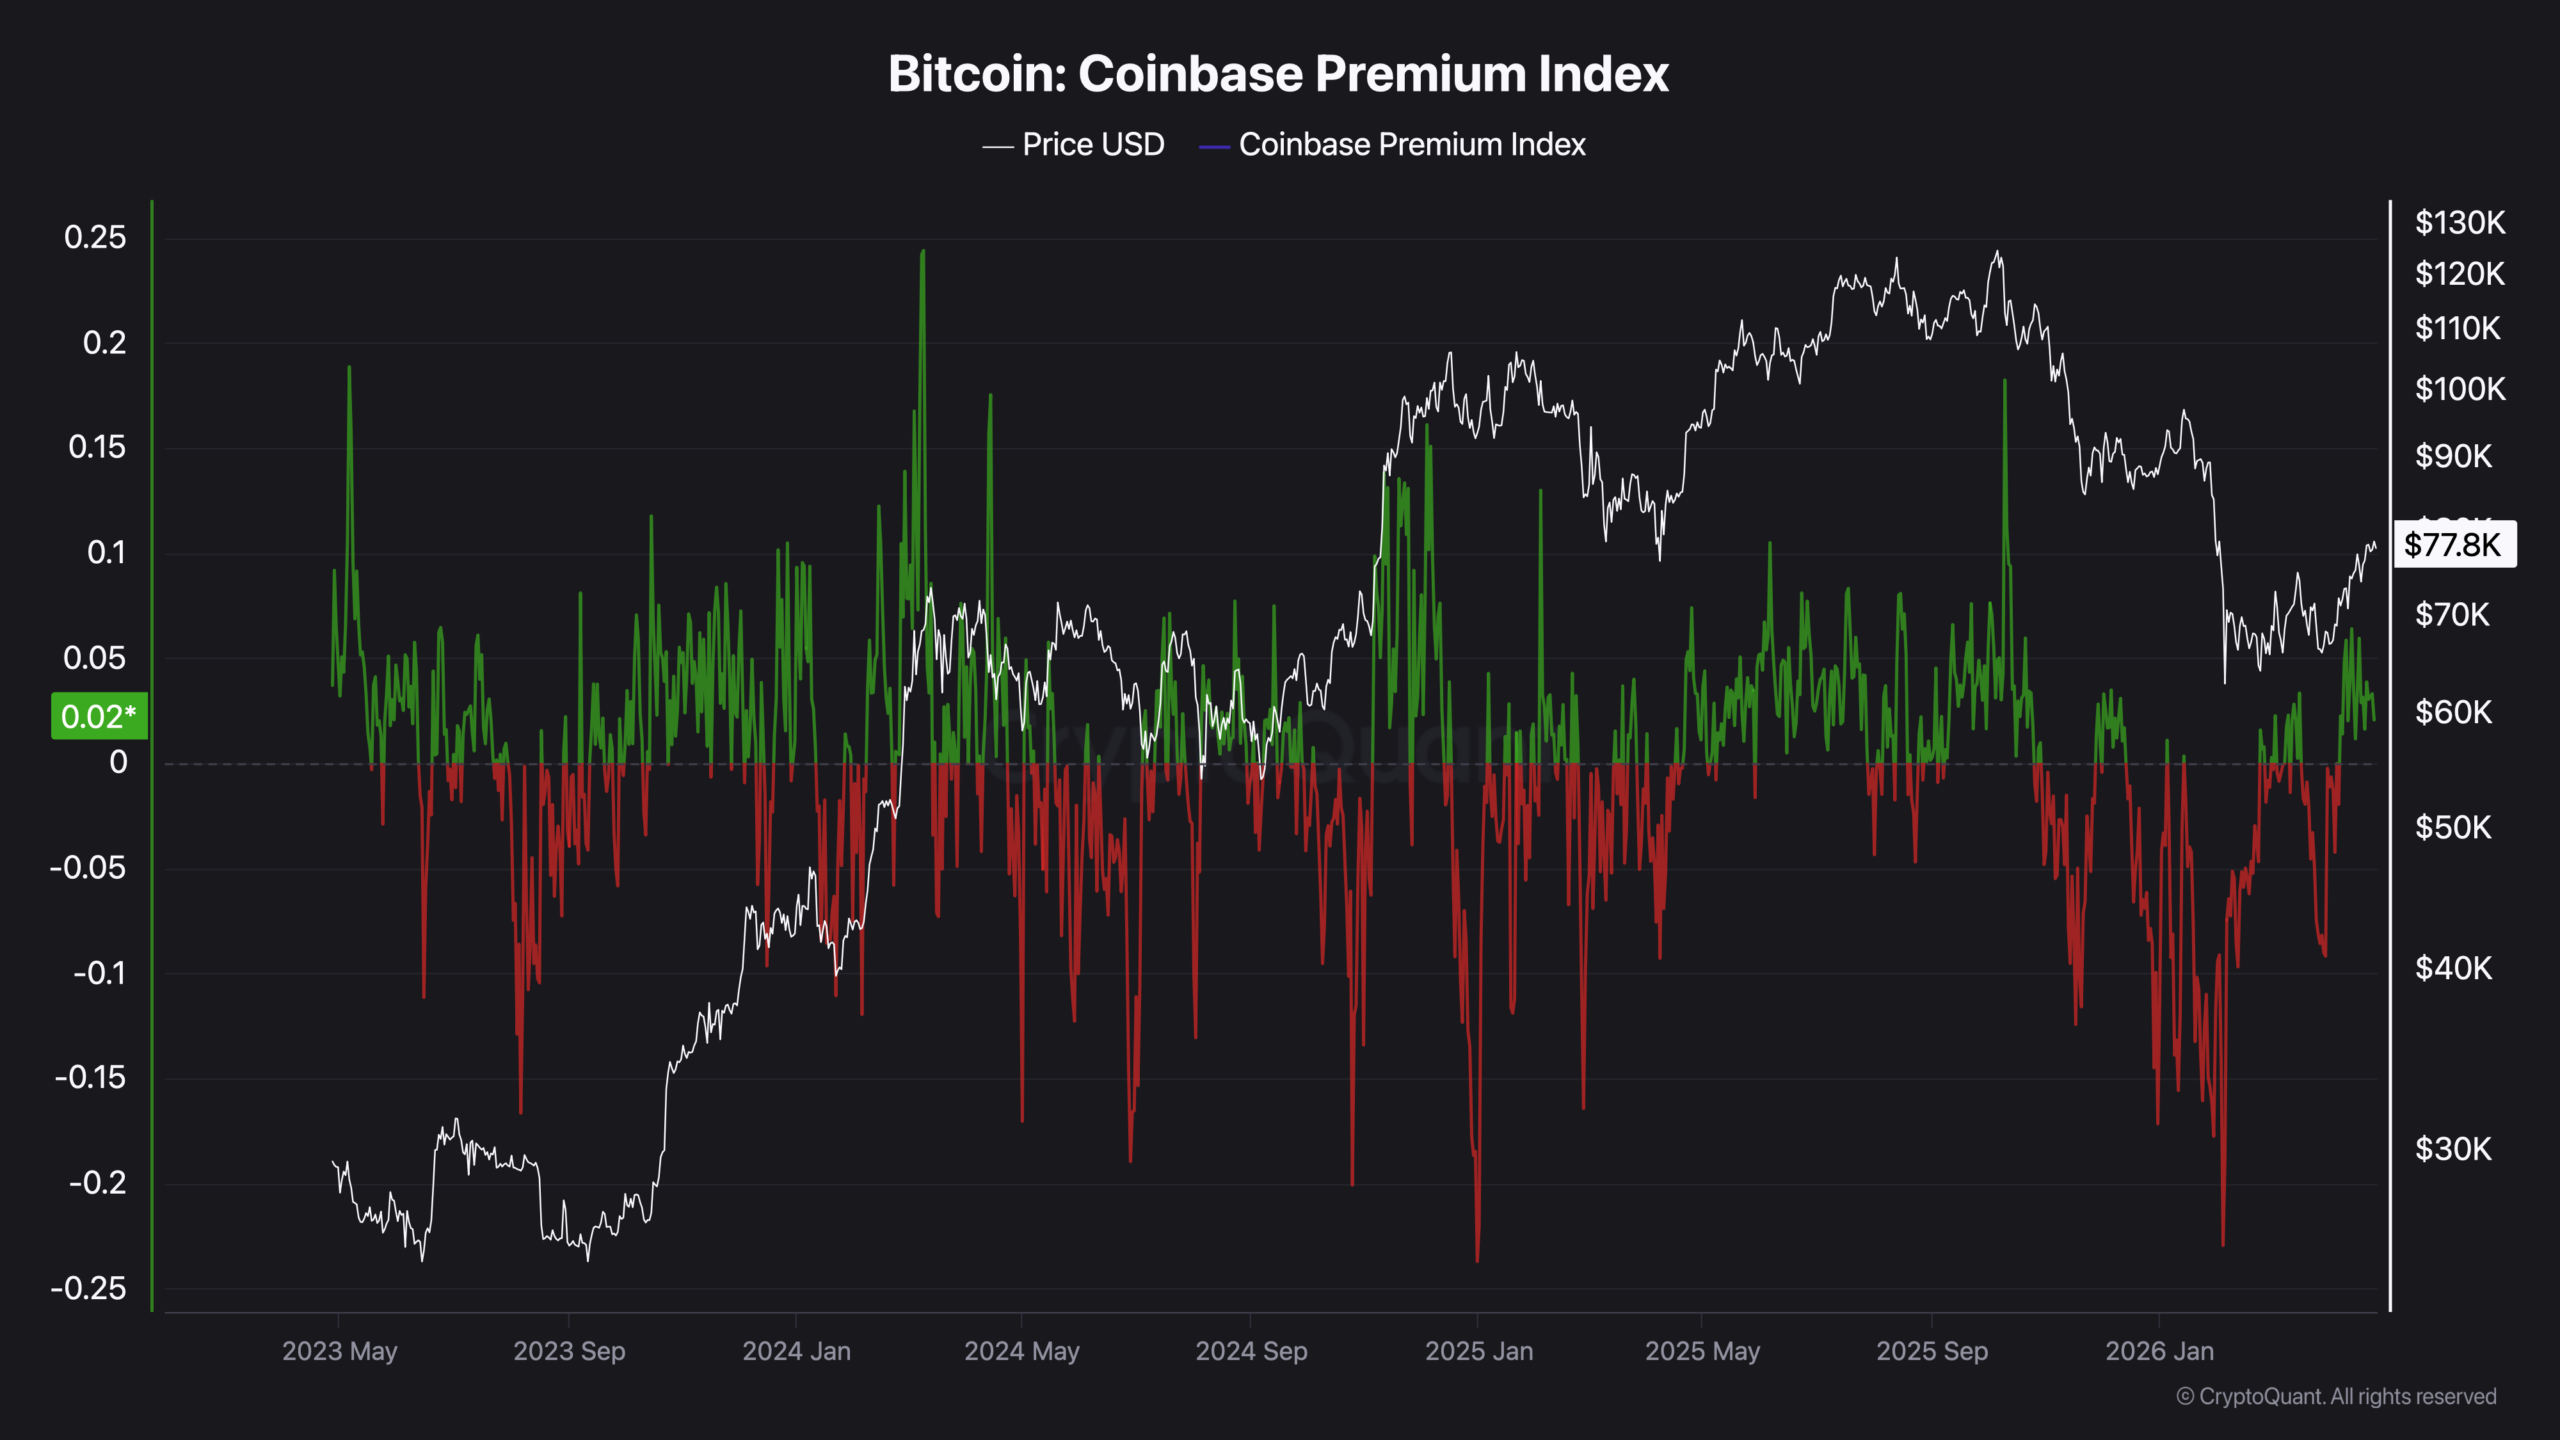
It was driven by other participants, Asian session buyers, derivatives positioning, retail momentum, none of which have the capital depth to sustain a push through a level where significant sell-side supply is positioned. Historically, price making new highs while the Coinbase Premium declines has preceded corrections rather than breakouts. The current instance is consistent with that history.
What is keeping institutional buyers away
The macro reasons for institutional absence explain the why. The price chart shows the what.
Two specific events within three weeks create reasons for institutional caution. The Federal Reserve’s FOMC rate decision arrives on April 29. Jerome Powell will deliver what markets expect to be his final remarks before Kevin Warsh takes over as Fed Chair on May 15. Warsh has publicly criticized quantitative easing and balance sheet expansion, the exact policies that have historically correlated with Bitcoin price appreciation.
Large-scale buyers who model Bitcoin as a dollar debasement hedge have a specific reason to pause when the incoming Fed Chair is on record opposing the policy that makes their thesis work. This is not generic macro uncertainty. It is a direct challenge to the investment thesis that brought institutional capital into Bitcoin in the first place.
The geopolitical context compounds the caution. Peace talks between the US and Iran remain stalled in Islamabad. Oil prices are surging on energy inflation fears. Bitcoin has shown sensitivity to Iran-related headlines throughout April, the ceasefire extension on April 22 triggered a rally, the stalled talks are now pulling risk appetite back.
The technical picture
RSI at approximately 63 on the daily was showing a bearish divergence, price making higher highs while RSI made lower highs. The 1-hour chart tells a sharper story. During the $79,488 attempt, RSI pushed into overbought territory above 75. The rejection candle that followed collapsed RSI to 39.54 in a single hour, crashing below the signal line at 62.43 in the same move.
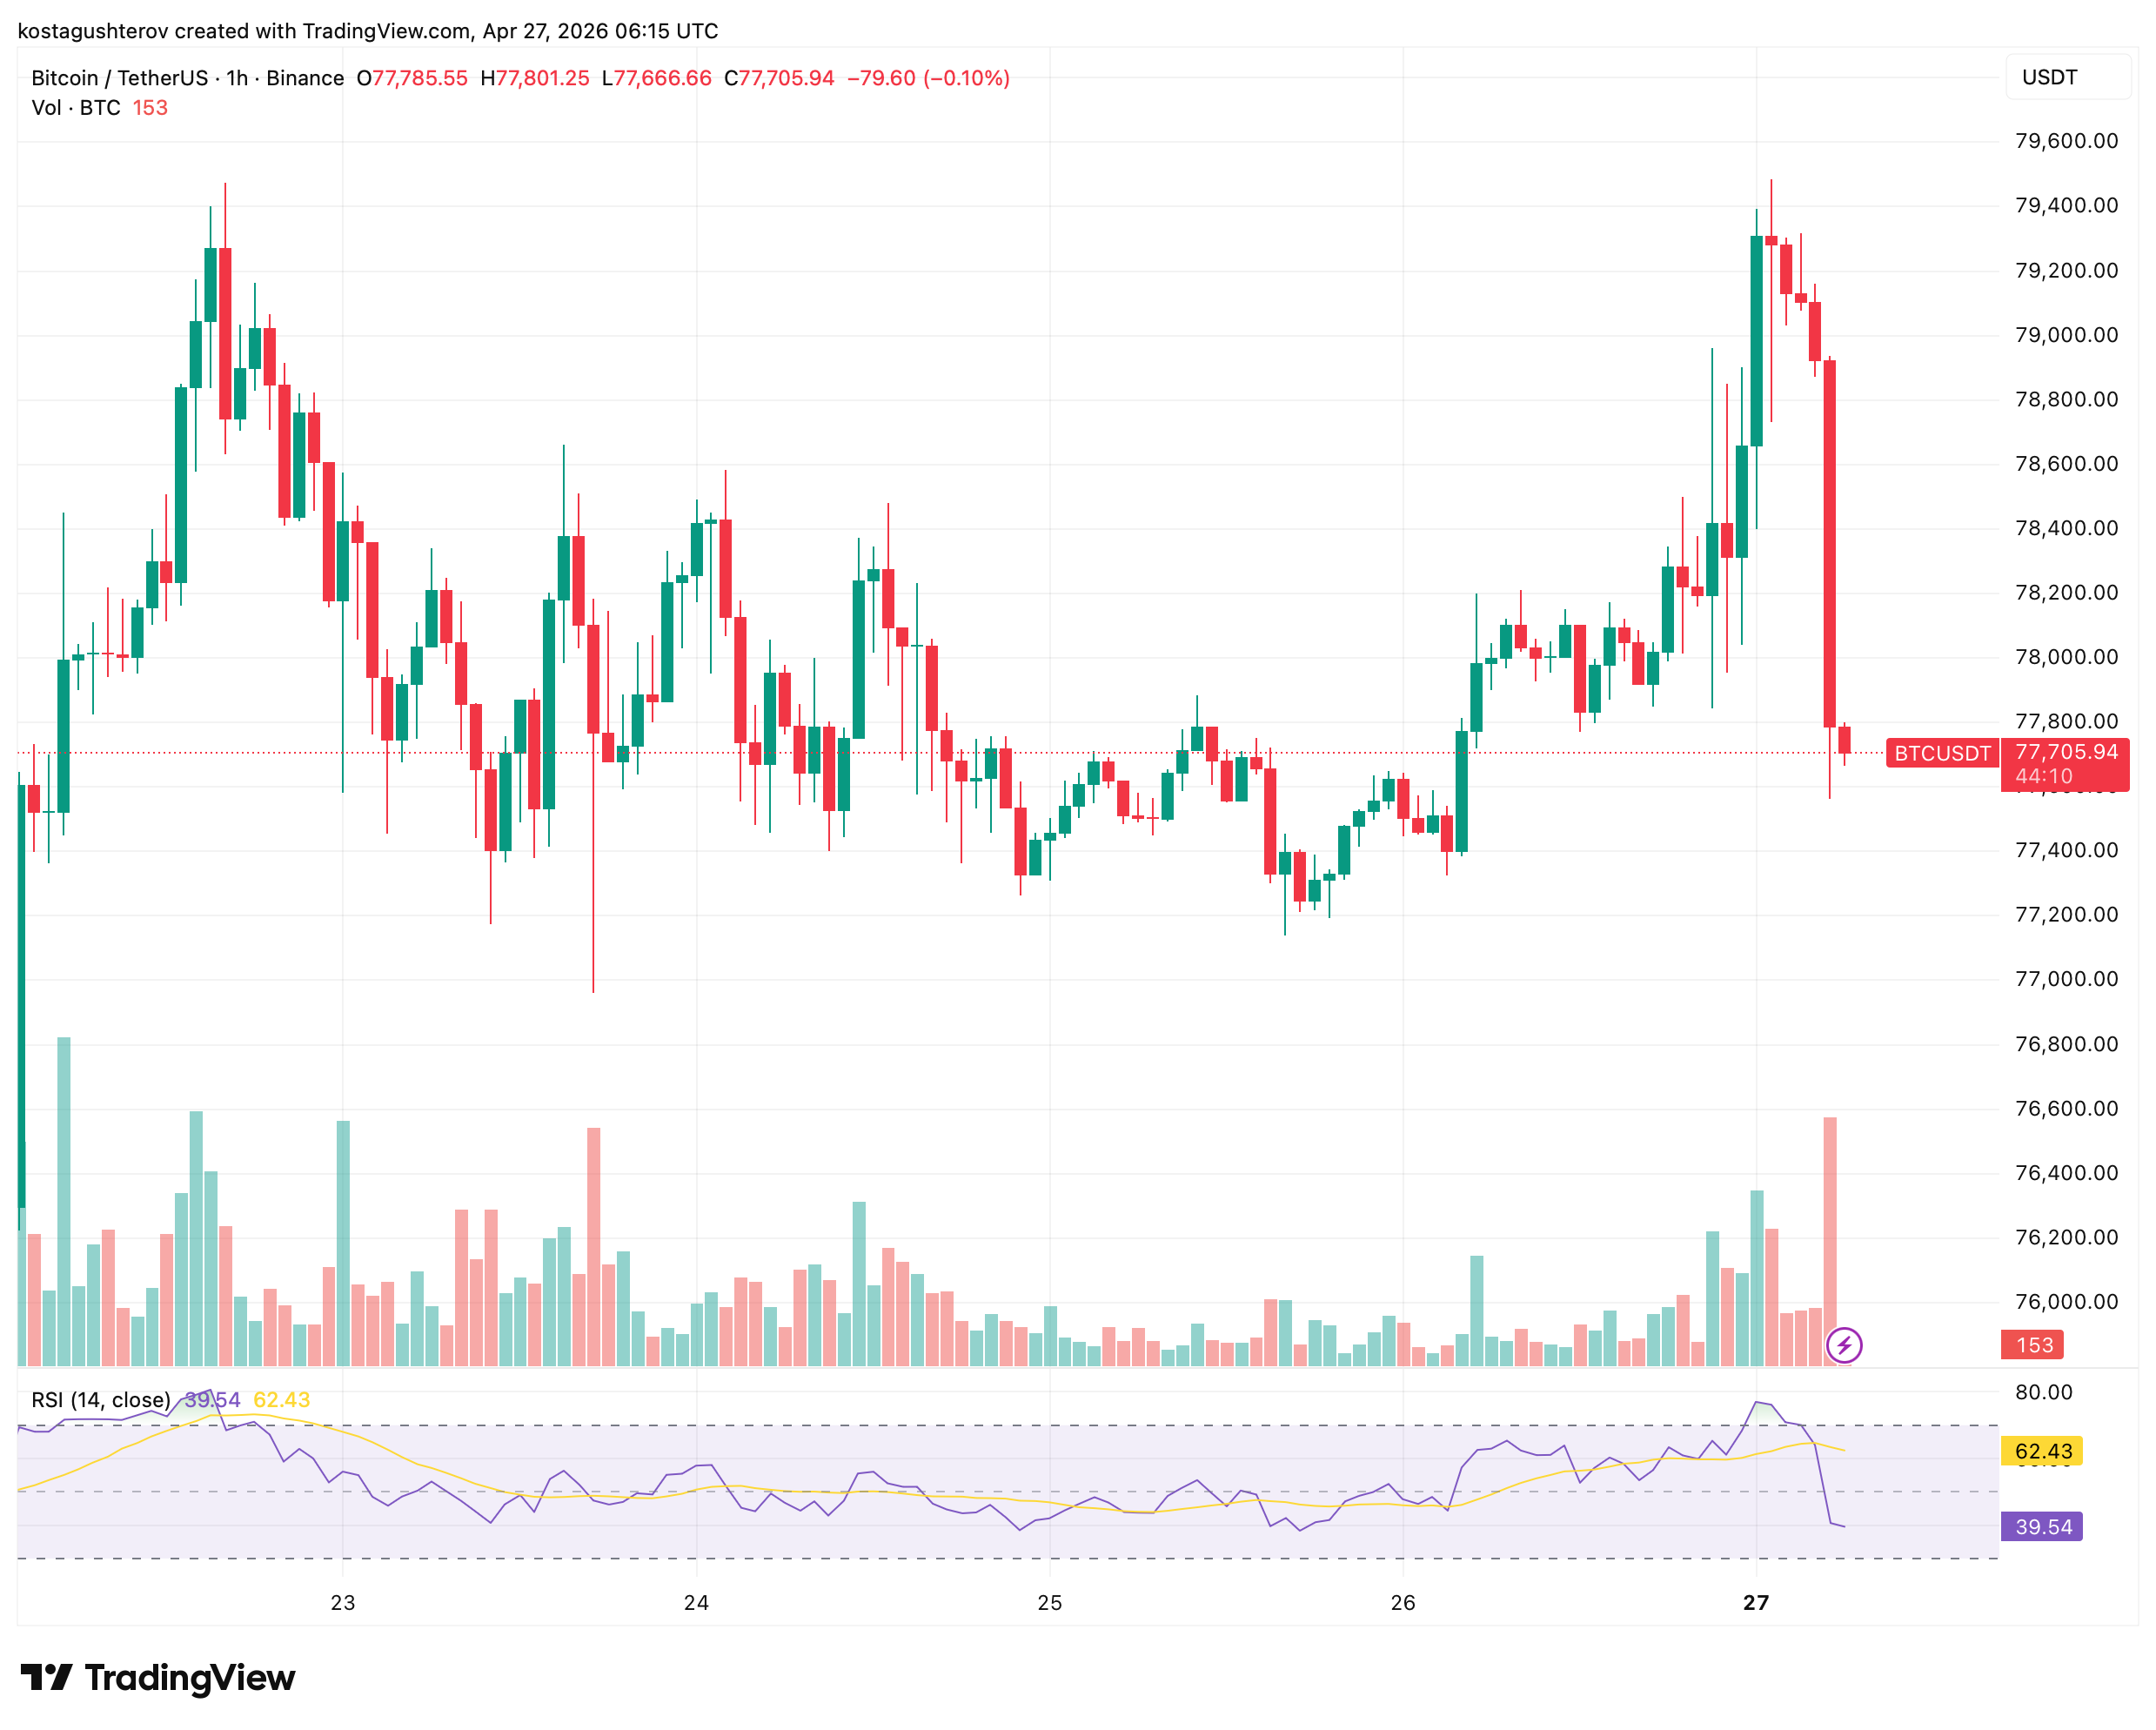
A drop of that magnitude in a single candle is not gradual momentum deterioration. It is the signature of aggressive selling overwhelming the market simultaneously, stop-loss cascades, coordinated exits, or both. Gradual resistance failures produce gradual RSI declines. This produced an acute collapse. The character of the rejection matters: this was not price drifting away from $80,000. It was price being pushed away from it.
The return to $77,705 is structurally telling. That level was the top of the prior consolidation range before the April 26-27 spike. The 12-week high attempt has been entirely erased, price is back where it started before the breakout attempt began. The spike left no structural progress. If $77,700 fails to hold, the next support levels at $76,900 and $75,000 become the relevant frame rather than the breakout levels above.
A daily close above $79,500 would invalidate the bearish signal and open the technical path toward $82,000-$83,850. Without that close, the support structure is what matters.
What $80,000 actually represents and what resolves it
The six-for-six rule, in 13 years Bitcoin has never revisited a cycle low after a 30% recovery, has $80,000 as its activation threshold. Three failed attempts with declining institutional participation means the rule is waiting, not confirmed.
The CMC Fear and Greed Index at 44, neutral, is the accurate summary. Not fearful enough to represent a buying opportunity on sentiment alone. Not greedy enough to suggest the breakout has been priced in. Exactly at the midpoint where the next catalyst determines direction.
That catalyst is not a price level. It is the Coinbase Premium recovering toward its April 22 reading of 0.038 after FOMC clarity arrives on April 29. A premium returning to that level while price holds above $77,700 would be the first on-chain confirmation that large-scale buyers have re-entered rather than simply paused. Until that signal appears, three rejections and a 47% premium decline describe a market that reached its highest level in 12 weeks on the weakest institutional foundation of the entire move.
The information provided in this article is for educational purposes only and does not constitute financial, investment, or trading advice. Coindoo.com does not endorse or recommend any specific investment strategy or cryptocurrency. Always conduct your own research and consult with a licensed financial advisor before making any investment decisions.
The post Bitcoin Touched $79,500 and Fell Back to $77,500: On-Chain Data Shows Why appeared first on Coindoo.
Source: https://coindoo.com/bitcoin-touched-79500-and-fell-back-to-77500-on-chain-data-shows-why/
More Crypto News
Check our Market Overview
Disclaimer: This article is for informational purposes only and does not constitute financial advice. Always conduct your own research (DYOR).


