Key Takeaways ETH trades for $2,250. RSI(14): 45.60 faster signal, 38.77 slower signal, diverging by 6.83 points. Taker buy volume: […]
The post Ethereum at $2,250 After FED’s Hawkish Hold: $1B in Buying Followed in One Hour appeared first on Coindoo.
Key Takeaways
- ETH trades for $2,250.
- RSI(14): 45.60 faster signal, 38.77 slower signal, diverging by 6.83 points.
- Taker buy volume: $1B on Binance in one hour below $2,300, largest in 10-day window.
- OKX simultaneous buying: approximately $20M in the same period.
- Fed decision: rates held at 3.5% to 3.75%, hawkish tone on inflation.
- Taker buy/sell ratio: 0.97, below 1.0 but 30-EMA trending upward since February.
- Open interest: 5B, recovered proportionally from 3.8B February low.
- January OI peak: 8.5B at $3.2K-$3.4K price, current leverage 41% below that peak.
The Fed Drop That Created The Entry
The Federal Reserve held interest rates unchanged at 3.5% to 3.75% on April 30, 2026, and indicated that short-term inflation could move higher due to rising energy prices. The standard market response to a hawkish Fed signal is risk-off: equity and crypto prices decline as the cost of capital remains elevated and rate cut expectations diminish. Ethereum dropped from approximately $2,380 to $2,257, a 5.1% move in the hours following the announcement.


Then $1B in taker buy volume entered Binance in a single hour below the $2,300 level. OKX simultaneously recorded approximately $20M in buying flows over the same period. According to CryptoQuant data, this was the largest single-hour taker buy response in the 10-day observation window. The sequence matters: the hawkish Fed signal produced the price drop, and the price drop produced the institutional buy response. The buyers who entered at $2,257 were not deterred by the macro signal. They were waiting for the price level it created.
Taker buy volume measures the aggressor, the buyer who crosses the spread to take the offer at market price rather than waiting for the price to come to them. $1B of taker buy volume in one hour is not retail behavior. It is a pre-set threshold being triggered: price reaches a level, an algorithm or an institutional order fires, the volume registers as aggressive buying. The hawkish Fed was not a headwind for these buyers. It was the mechanism that delivered their entry price.
What The Ratio Trend Says That The Current Reading Does Not
According to CryptoQuant data, the ETH taker buy/sell ratio on Binance currently sits at 0.97, just below the 1.0 neutral line, indicating marginal sell dominance in the current session. Taken in isolation, 0.97 is a bearish reading. The CryptoQuant chart covering May 2025 through April 2026 provides the context that changes its interpretation.
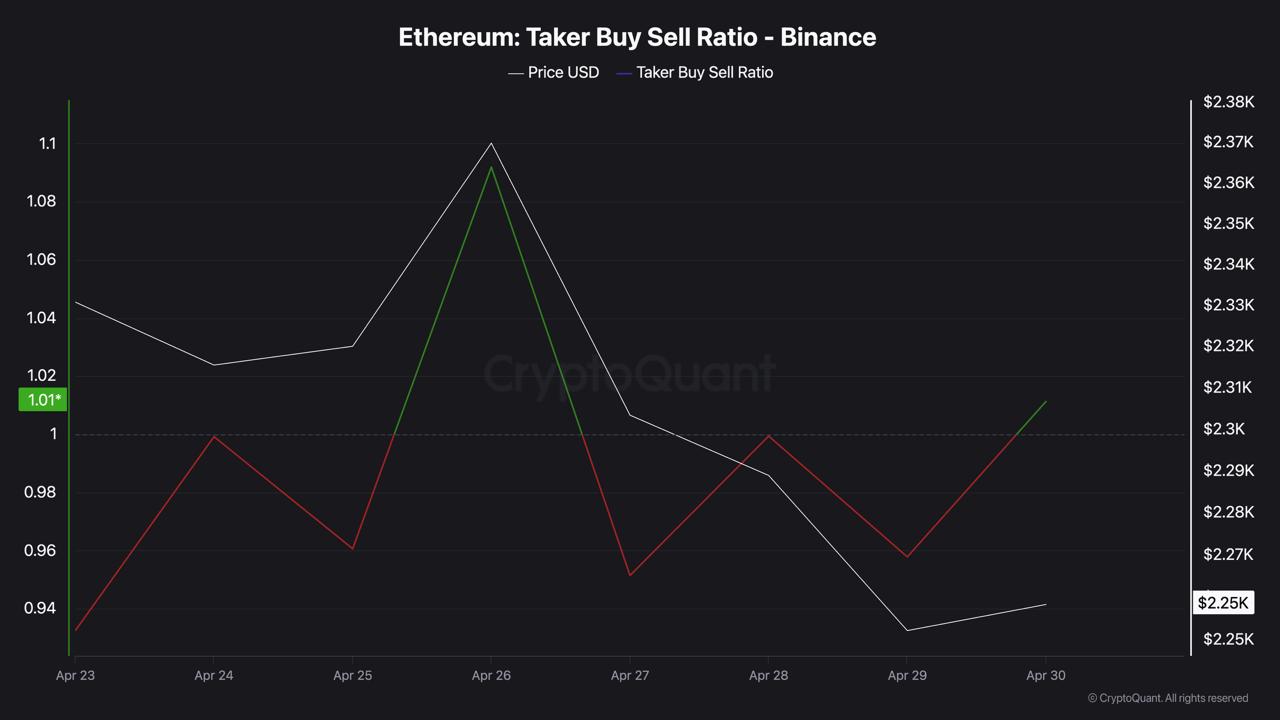
The 30-period EMA of the ratio has been rising since the February 2026 low, when price collapsed to $1,750 and the ratio fell to approximately 0.955. The arrow annotated on the chart traces this upward trend through March and into April 2026. The current 0.97 reading sits above the February low and within a rising EMA channel. A ratio below 1.0 within a rising EMA channel is a dip, not a reversal. The session reading alone cannot make that distinction. The 30-EMA does.
The CryptoQuant sentiment analysis covering the March-April period confirms the trend reading: longs have been dominating aggressive trading and new leverage has been flowing primarily into long positions. The April 30 session dip to 0.97 is the first sub-1.0 reading since the trend established itself, a session response to the Fed drop, not a structural change.

OI At 5B: Cautious Leverage, Not Speculative
Ethereum open interest on Binance peaked at approximately 8.5B in January 2026 when price was trading between $3,200 and $3,400. The February collapse brought OI from 8.5B to approximately 3.8B, a 55% reduction as leveraged positions were liquidated across the decline to $1,750. Since the February low, OI has recovered to 5B as price recovered to $2,257, a 31% OI recovery against a 29% price recovery. The two figures are nearly identical.
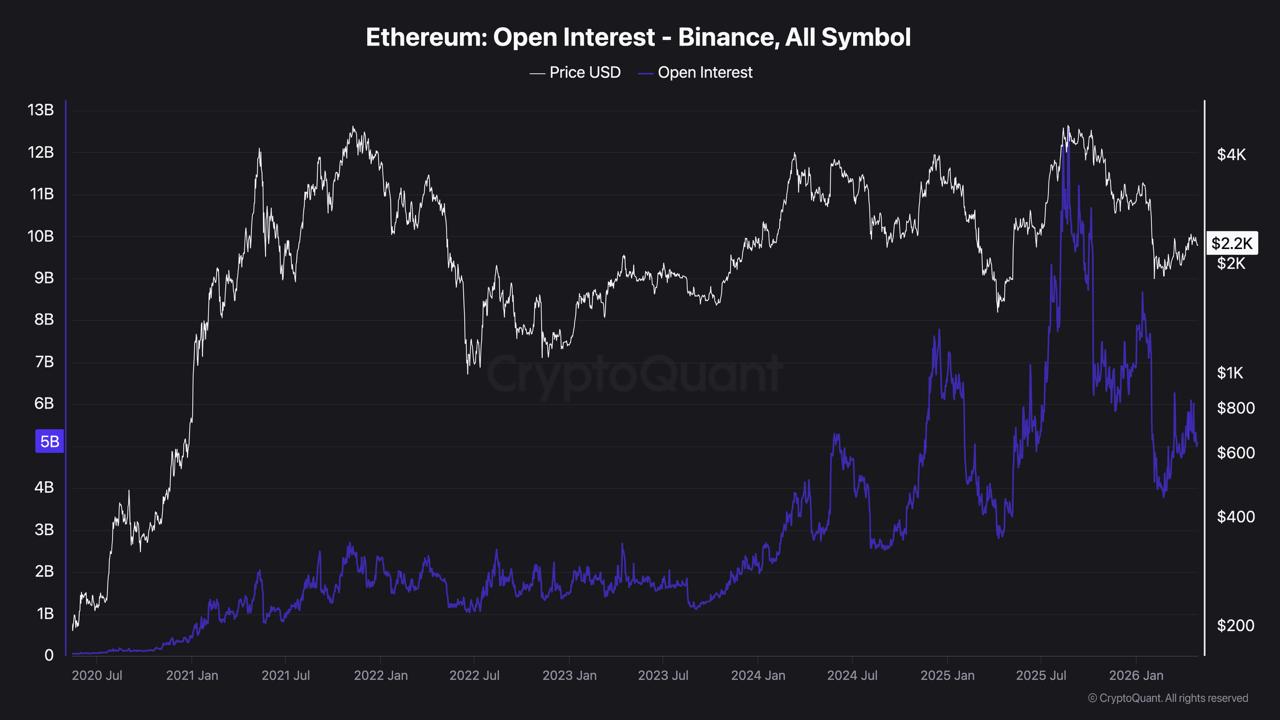
That proportionality is the key data point. When OI grows faster than price, the leverage is speculative, traders are adding exposure ahead of the price move they are betting on. When OI grows at the same rate as price, the leverage is following price rather than leading it. At 5B, ETH’s open interest is 41% below its January peak despite price being only 30% below the January price range. The OI has not recovered as aggressively as price. CryptoQuant’s analysis confirms: “leverage volume has only increased modestly and has not exploded, traders are building positions cautiously, leaning Long but not taking excessive risk.” The derivatives market is constructive without being fragile.
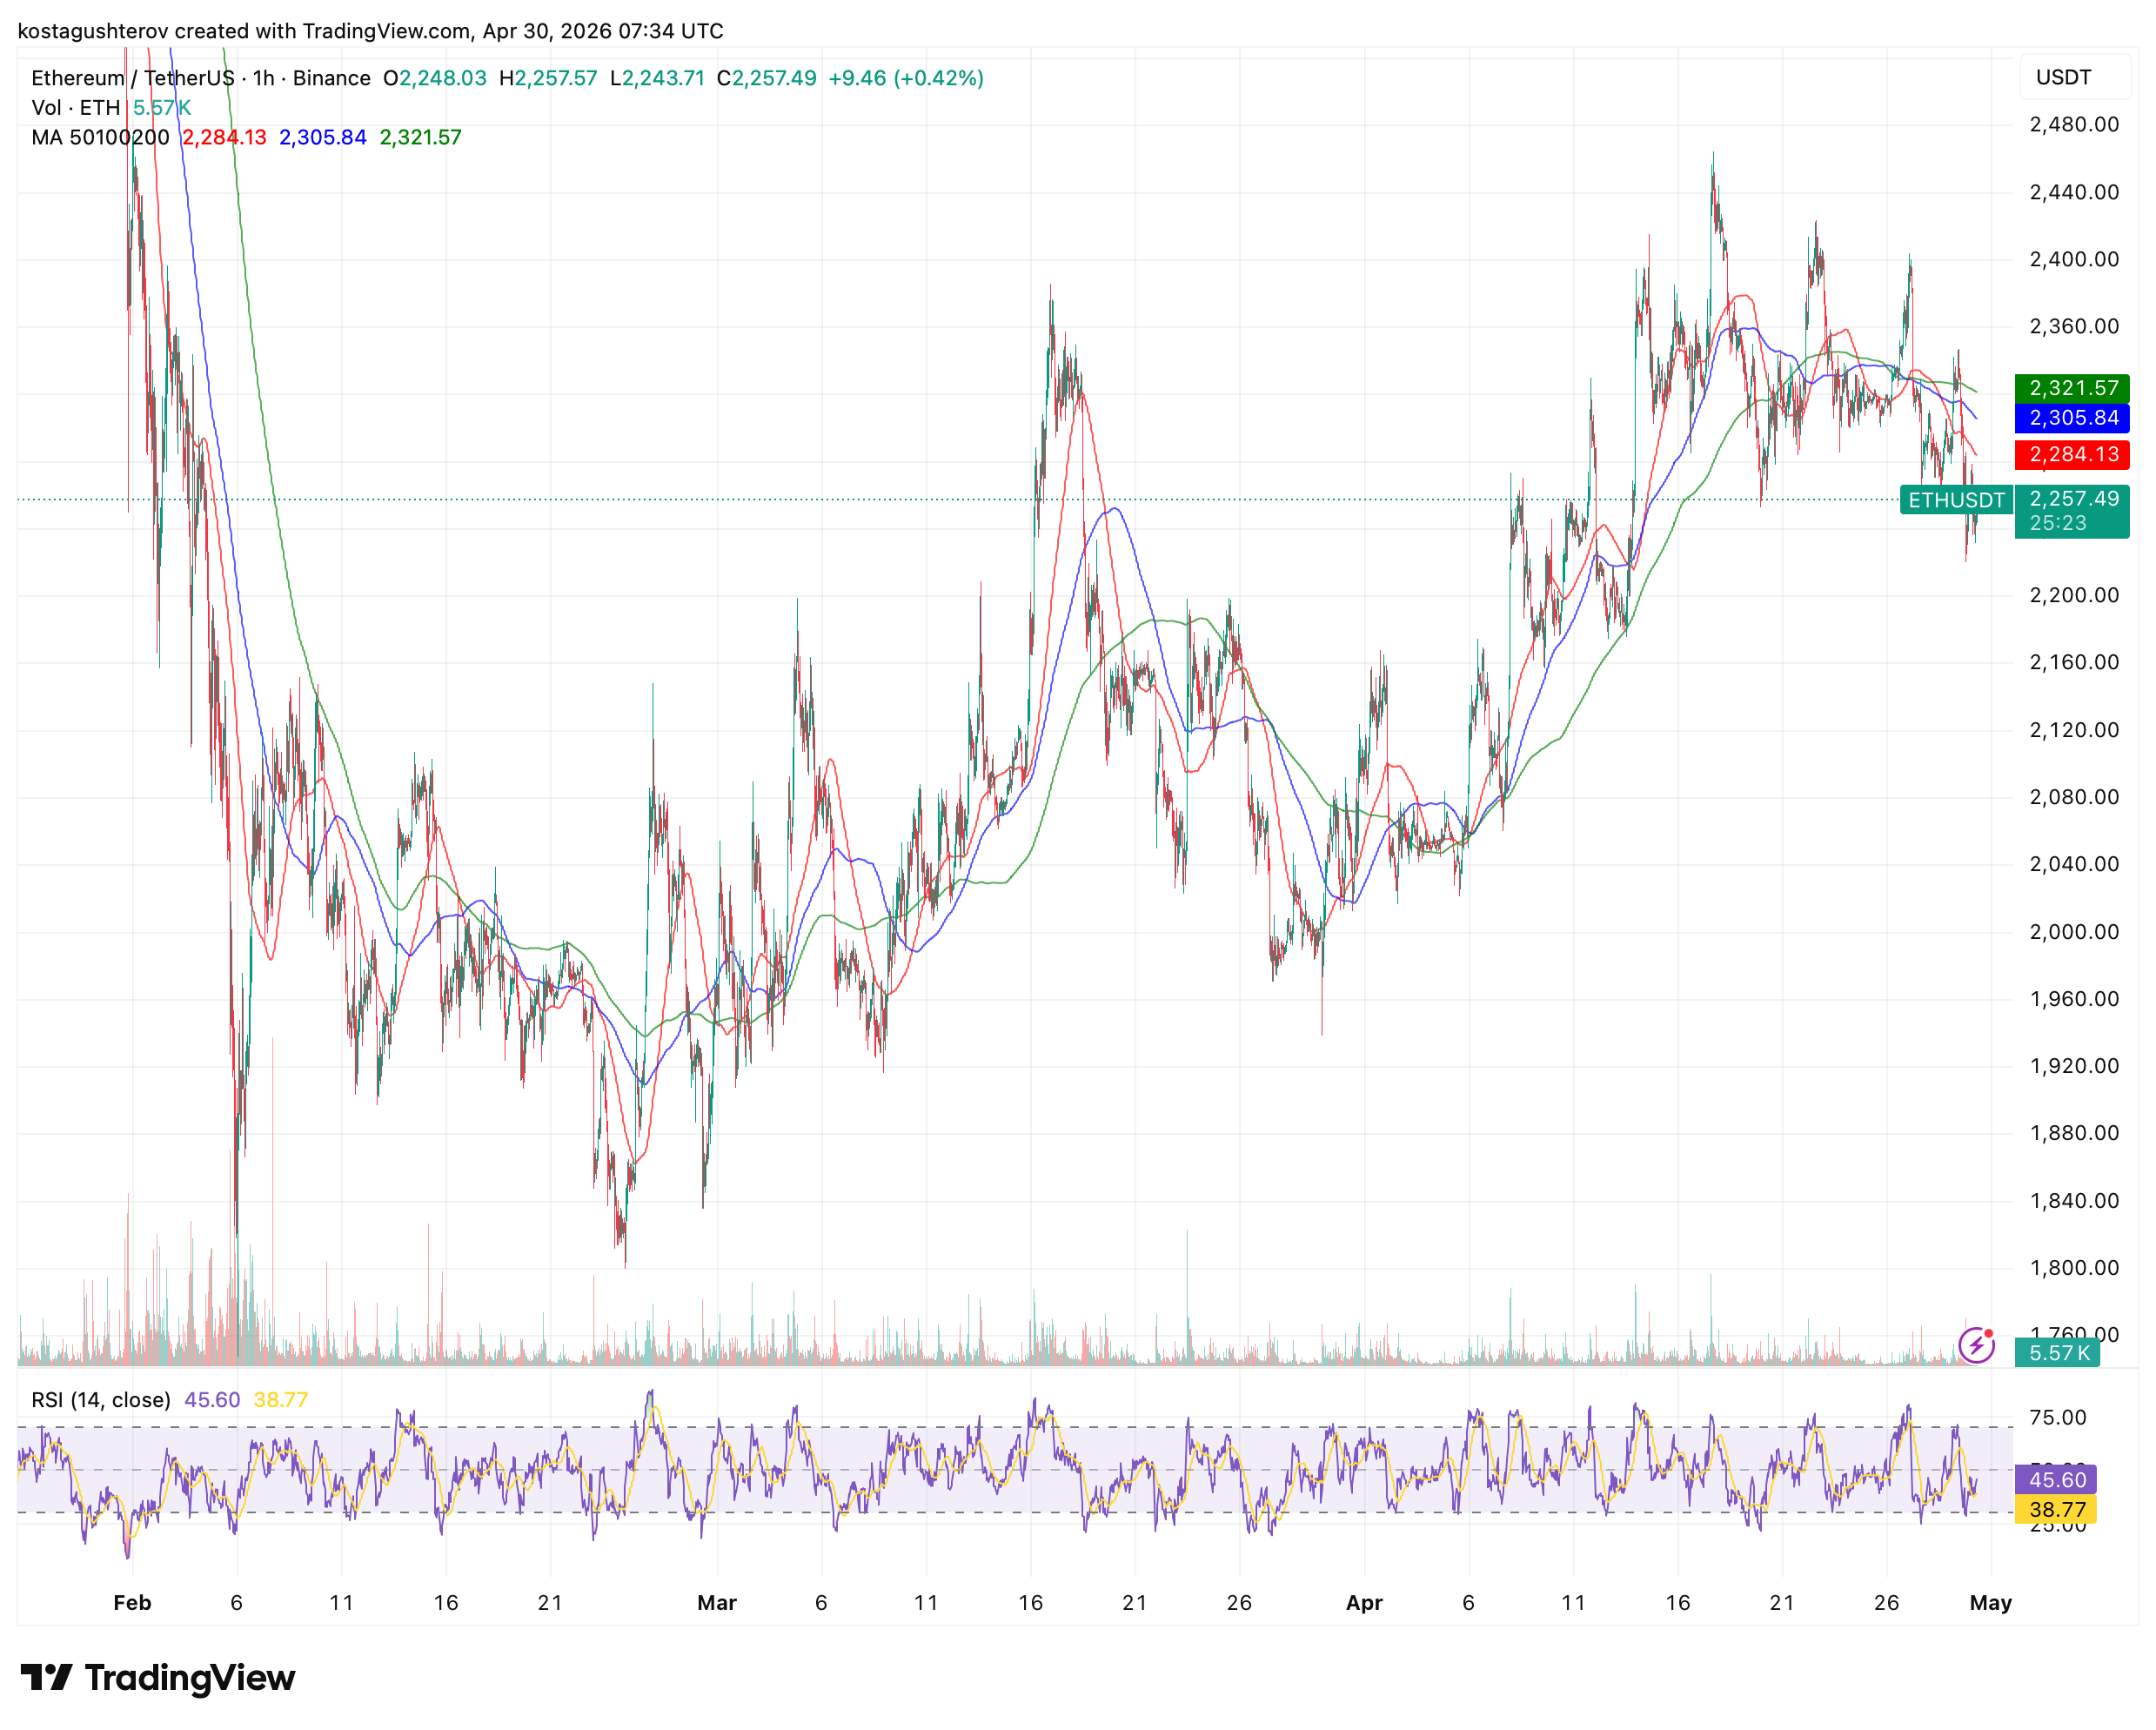
The RSI Clock And What It Is Timing
The most important technical detail on the hourly chart is not the price level. It is the divergence between the two RSI signals. The faster RSI at 45.60 is in neutral territory and has already stabilized from its recent low. The slower RSI at 38.77 is approaching oversold and is still falling. The gap between them is 6.83 points, wider than it has been for most of the April period.
This divergence has a specific meaning. The faster signal measures very short-term momentum. It has already registered the $1B buying event and is stabilizing. The slower signal measures medium-term momentum and is still completing the downward cycle that began when price peaked at $2,450. The two signals are not contradicting each other. They are measuring two different things at the same moment: the very short-term floor forming and the medium-term momentum still working through its cycle.
The bearish counter is that $1B of taker buy volume in one hour is a large number that the sell pressure absorbed without producing a sustained bounce. ETH is still at $2,257, below where the buying entered. If the institutional buyers at $2,257 were genuinely establishing a floor, price would not still be at $2,257 hours later. The fact that it has not bounced meaningfully above the entry level suggests the sell pressure is at least equal to the buying that entered, and the floor is being tested rather than confirmed.
The resolution has two paths. If the slower RSI reaches oversold below 30 before the $2,200 support level breaks, the bounce will be mechanical, oversold conditions on both signals simultaneously tend to produce sharp recoveries regardless of the macro environment. If the $2,200 level breaks before the slower RSI reaches oversold, the divergence closes in the bearish direction and the bounce thesis requires a lower entry. The $1B buying at $2,257 suggests the institutional floor is above $2,200. The slower RSI at 38.77 and falling suggests that floor will be tested before the divergence resolves.
The 100MA At $2,305 And The Slower RSI Both Answer By Friday
The confirmation signal for the bounce thesis is a daily close above $2,305, the 100MA, with the faster RSI holding above 50 and the slower RSI beginning to recover from its current 38.77 reading. That combination would confirm the $1B buying event was a genuine floor rather than temporary absorption, and that both momentum signals are aligning rather than diverging further.
The denial signal is a close below $2,200 with the faster RSI falling back below 40 to converge with the slower signal. That convergence in the bearish direction would indicate the institutional buying at $2,257 was absorbed by continued sell pressure and the next support level is the $2,050 April 25 low. The 100MA at $2,305 is $47.51 above current price. The slower RSI resolves its oversold approach within 24 to 48 hours. Both answer before the end of the trading week.
The information provided in this article is for educational purposes only and does not constitute financial, investment, or trading advice. Coindoo.com does not endorse or recommend any specific investment strategy or cryptocurrency. Always conduct your own research and consult with a licensed financial advisor before making any investment decisions.
The post Ethereum at $2,250 After FED’s Hawkish Hold: $1B in Buying Followed in One Hour appeared first on Coindoo.
Source: https://coindoo.com/ethereum-at-2250-after-fed-hawkish-hold-1b-in-buying-followed-in-one-hour/
More Crypto News
Check our Market Overview
Disclaimer: This article is for informational purposes only and does not constitute financial advice. Always conduct your own research (DYOR).


