
Key Takeaways Price is testing the weekly channel’s lower boundary Daily bounce came off the 200-day SMA Resistance stacks between […]
The post Zcash Price at a Key Floor on the Weekly Chart appeared first on Coindoo.
Key Takeaways
- Price is testing the weekly channel’s lower boundary
- Daily bounce came off the 200-day SMA
- Resistance stacks between $1,034 and $1,104
- Confirmed breakdown exposes support near $654
The pullback followed the NU7 network upgrade’s activation on November 6, with Grayscale’s Zcash Trust recording outflows in early November and a community vote on development funding open until November 30.
The weekly chart: higher lows, now at the channel floor
On the weekly chart, ZEC has built a series of higher lows since March inside a rising channel. That sequence carried price to a September high near $1,700, and it is why the broader structure is still bullish.


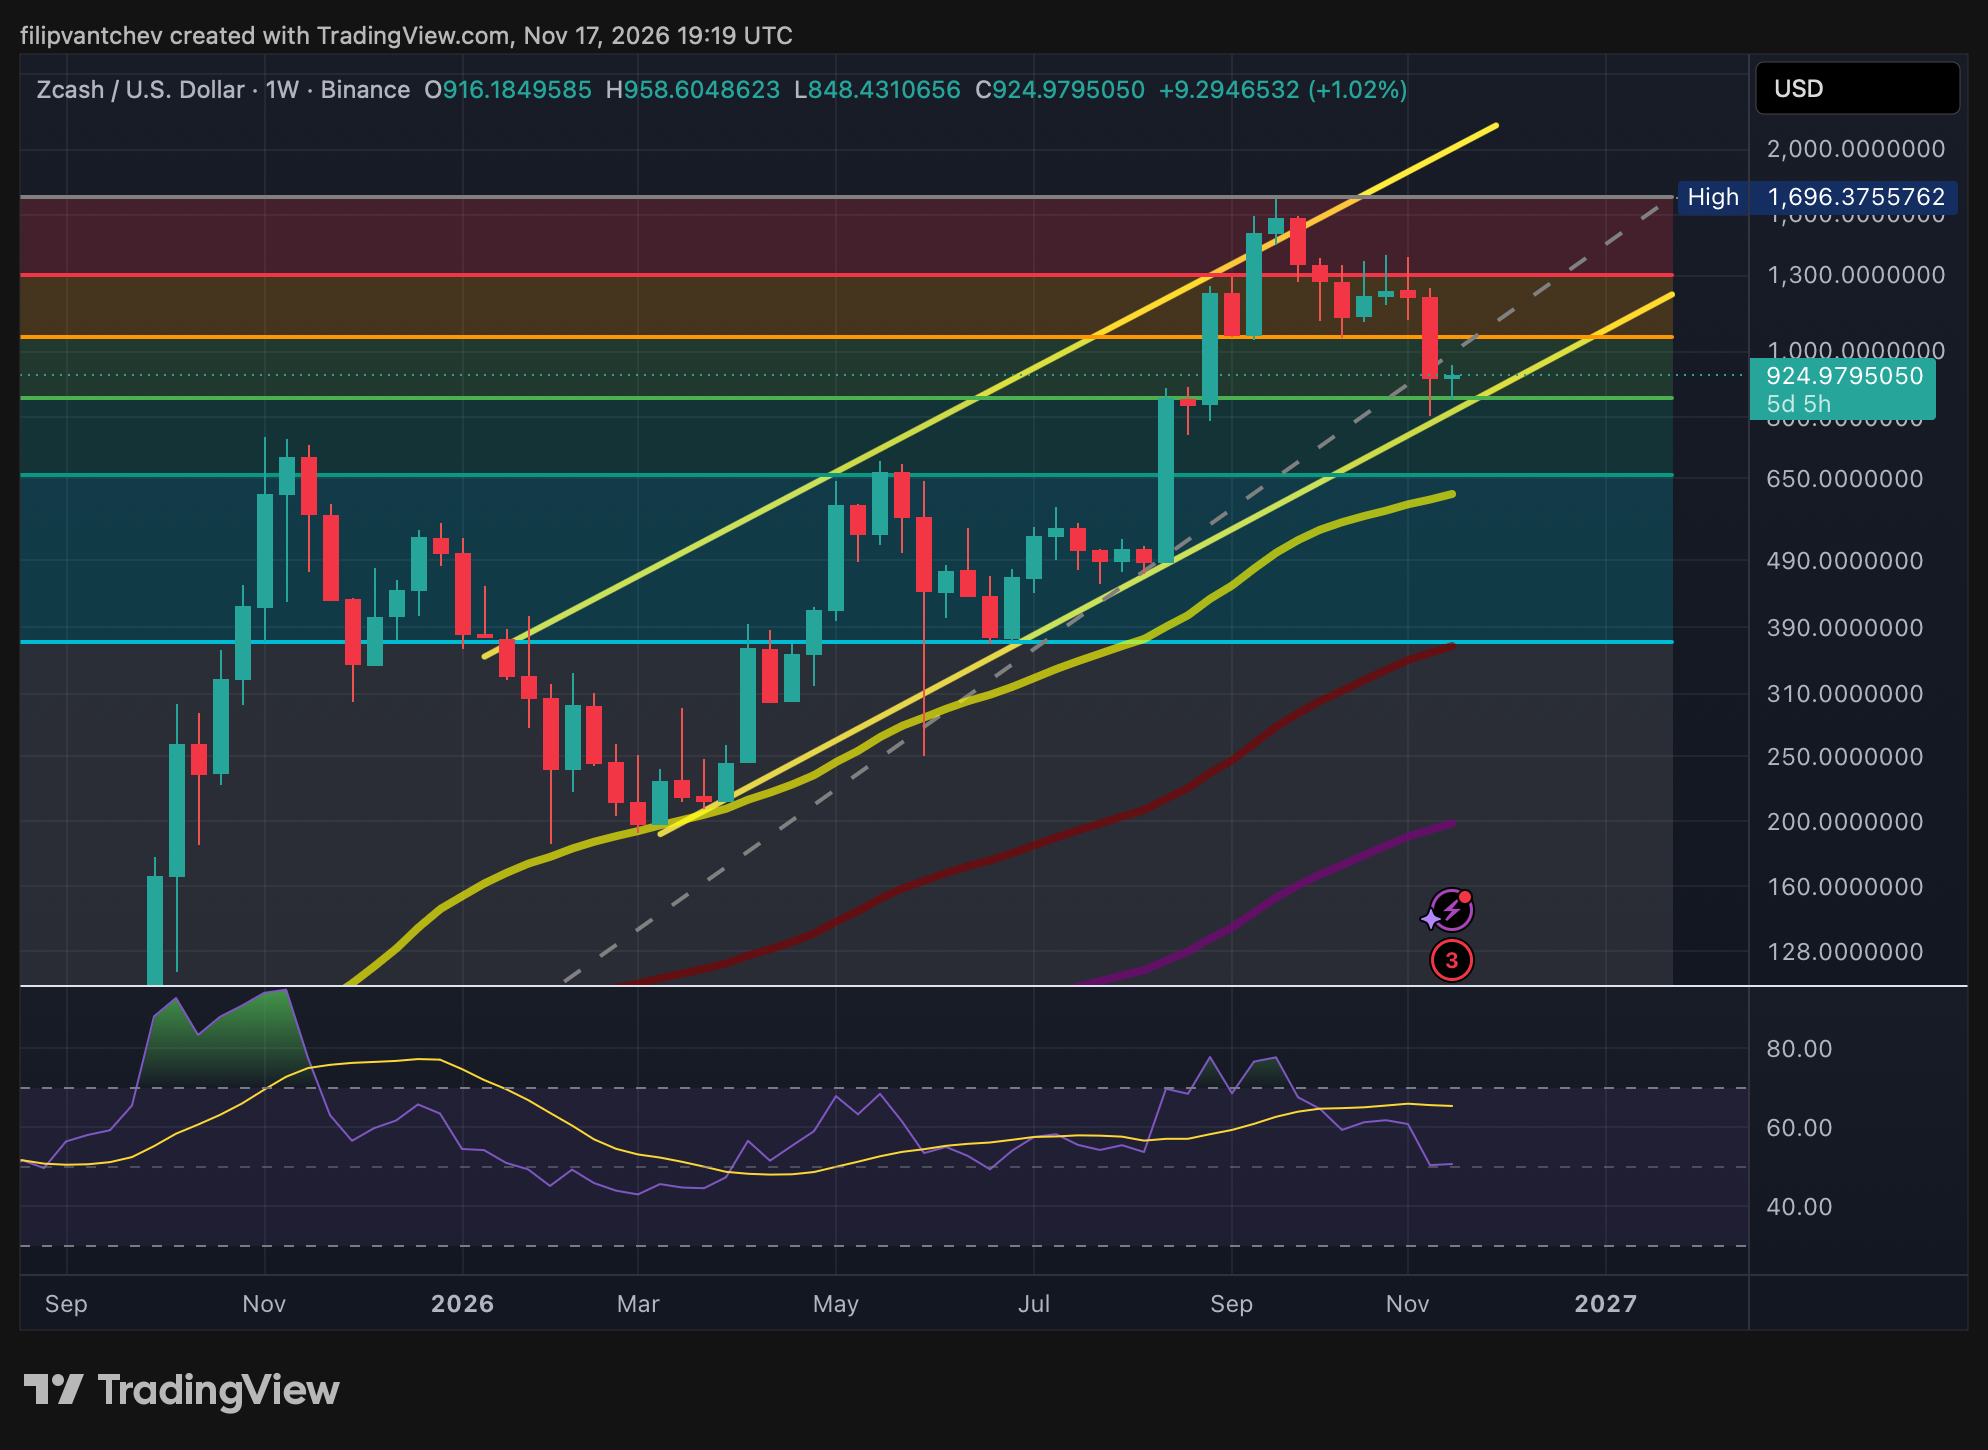
The past two months have taken back a large part of that run. ZEC now trades around $921, on the channel’s lower boundary. This week’s candle dipped below the line and recovered, so the floor has been probed but not broken on a weekly close.
The channel floor currently runs close to the 0.618 Fibonacci retracement near $877, measured from the June low near $369 to the September high. Holding the channel and holding that retracement are, for now, the same test.
The weekly RSI has fallen from overbought territory in September to the 50 midline, a neutral reading, neither stretched nor oversold. The 50-week SMA is still rising, well below current price.
The daily chart: where the bounce started
The recent low formed where the 200-day SMA, now around $802, meets the descending trendline drawn from the September peak. Price has bounced from that intersection.
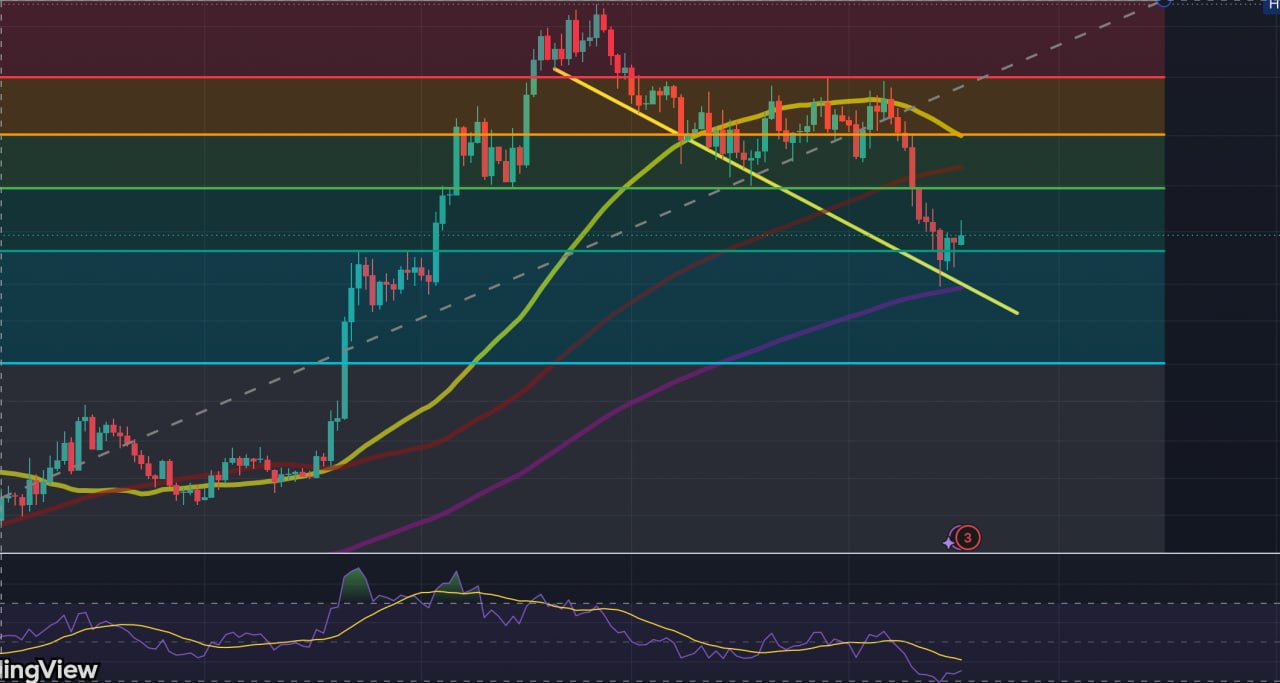
The daily RSI dropped close to the 30 oversold line during the sell-off and has started to turn up, though it remains below its signal line. Price is trading just above the 0.618 retracement, and a daily close above that level would confirm buyers are defending it.
The $1,050 area and what sits above it
The area around $1,050 sits inside the first band of overhead resistance, between the 0.5 retracement and the 100-day SMA. The weekly channel’s dashed midline crosses the same area. ZEC fell through that band during the November sell-off, and it has not traded back above it since.
First band
0.5 retracement near $1,034
100-day SMA around $1,104
Second band
0.382 retracement near $1,191
50-day SMA around $1,199
Each band pairs a Fibonacci level with a moving average, so a daily close above the first would still leave the second overhead. The 50-day SMA has also turned lower after flattening through October.
What the weekly close decides
The channel is drawn on the weekly chart, so the weekly close is the one that counts.
This analysis is for information purposes only and does not constitute financial or investment advice.
The post Zcash Price at a Key Floor on the Weekly Chart appeared first on Coindoo.
Source: https://coindoo.com/zcash-price-at-a-key-floor-on-the-weekly-chart/


More Crypto News
Check our Market Overview
Disclaimer: This article is for informational purposes only and does not constitute financial advice. Always conduct your own research (DYOR).