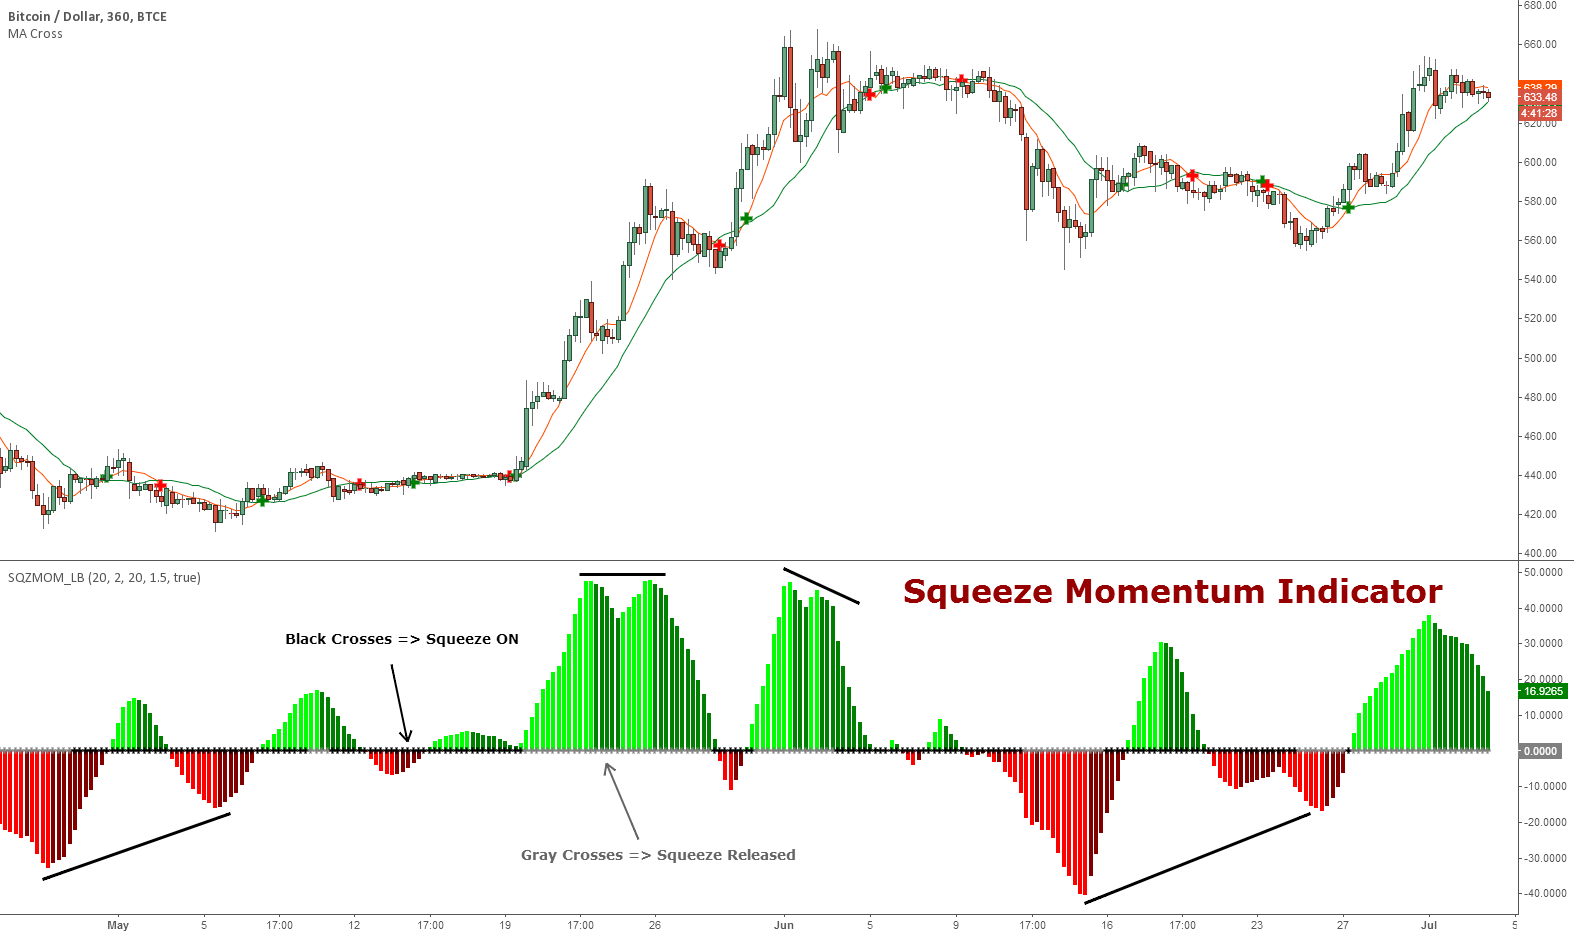
The Squeeze Momentum Indicator, also known as the Squeeze Momentum Histogram (SMH), is a powerful technical tool used in financial analysis. It combines elements of two popular indicators, the Bollinger Bands and the Moving Average Convergence Divergence (MACD), to provide insights into potential trend reversals and momentum shifts in the market. This article aims to provide a detailed analysis of the Squeeze Momentum Indicator, its calculation, interpretation, and practical applications in trading strategies.
- Understanding the Squeeze Momentum Indicator: The Squeeze Momentum Indicator is primarily used to identify periods of consolidation and subsequent breakout moves. It helps traders anticipate potential price trends by evaluating the volatility and momentum in a given market. The indicator is represented as a histogram that oscillates above and below a zero line, indicating periods of low and high volatility.
- Calculation of the Squeeze Momentum Indicator: To calculate the Squeeze Momentum Indicator, the following steps are typically followed: a. Compute the Bollinger Bands: Calculate the standard deviation of price using a specified period and standard deviation multiplier. b. Calculate the Bandwidth: Divide the difference between the upper and lower Bollinger Bands by the middle band (usually a moving average). c. Compute the Squeeze Momentum: Subtract the longer-term exponential moving average (EMA) of the Bandwidth from the shorter-term EMA.
- Interpreting the Squeeze Momentum Indicator: The Squeeze Momentum Indicator offers several key signals for traders: a. Squeeze: When the Squeeze Momentum Indicator moves from negative to positive, it indicates decreasing volatility and suggests an impending breakout or price expansion. b. Zero Line Crossover: When the histogram crosses above the zero line, it signals bullish momentum, indicating potential long opportunities. Conversely, a cross below the zero line suggests bearish momentum, indicating potential short opportunities. c. Momentum Divergence: Divergence between the price action and the Squeeze Momentum Indicator can indicate trend reversals or weakening momentum. d. Histogram Width: A wider histogram signifies greater volatility and momentum, while a narrower histogram indicates decreasing volatility and a potential market consolidation.
- Practical Applications: The Squeeze Momentum Indicator can be utilized in various trading strategies: a. Breakout Trading: Traders can look for long positions when the histogram moves from negative to positive, signaling a potential breakout. Conversely, short positions can be considered when the histogram crosses below the zero line. b. Trend Confirmation: The Squeeze Momentum Indicator can be used to validate an existing trend. A rising histogram during an uptrend or a falling histogram during a downtrend strengthens the conviction in the prevailing market direction. c. Reversal Signals: Divergence between the price and the Squeeze Momentum Indicator can provide early indications of trend reversals. Traders can watch for bearish or bullish divergences to anticipate potential changes in the market sentiment.
The Squeeze Momentum Indicator is a valuable technical analysis tool that combines aspects of Bollinger Bands and MACD to identify market consolidation and potential breakout opportunities. Traders can leverage its signals to make informed trading decisions and manage risk effectively. However, like any indicator, it is important to use the Squeeze Momentum Indicator in conjunction with other technical tools and fundamental analysis for a comprehensive trading strategy. Regular practice, backtesting, and adapting to market conditions are key to successful utilization of this indicator.


