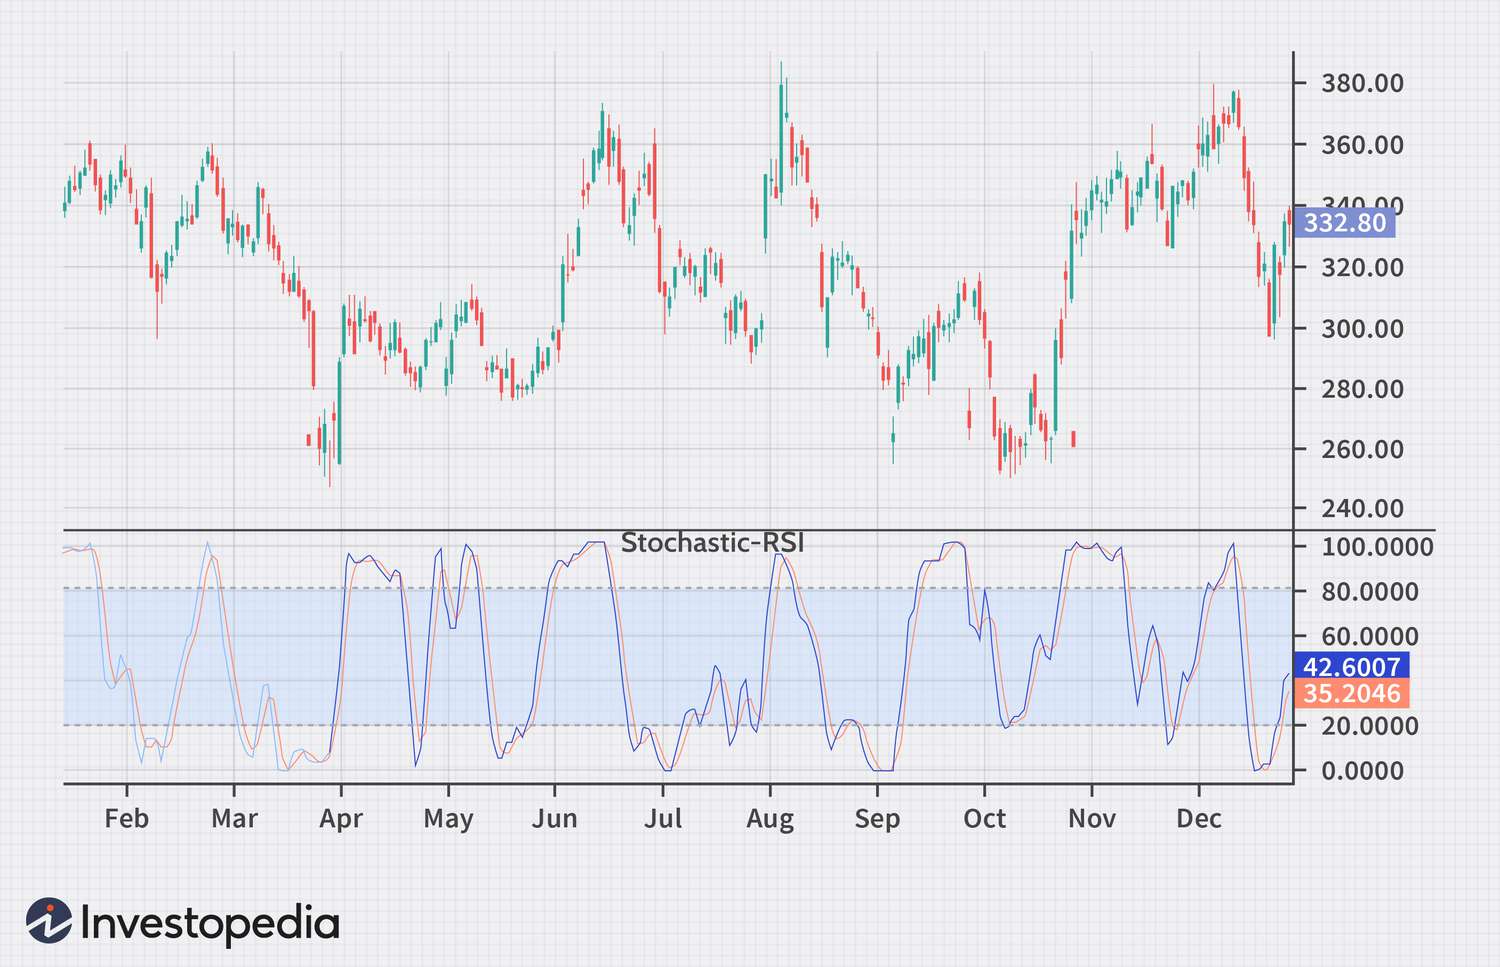
The Stochastic RSI indicator is a powerful tool used by traders to assess market strength and identify overbought or oversold conditions. In this article, we will delve into the details of the Stochastic RSI, including its definition, calculation, interpretation, and drawbacks.
What is the Stochastic RSI?
The Stochastic RSI, also known as the StochRSI, is a technical analysis indicator that combines the principles of the Stochastic Oscillator and the Relative Strength Index (RSI). It applies the Stochastic oscillator formula to a set of RSI values rather than standard price data. This combination provides traders with a more sensitive indicator that reflects a security’s historical performance[[2](https://www.investopedia.com/terms/s/stochrsi.asp)][[3](https://commodity.com/technical-analysis/stochastic-rsi/)][[4](https://corporatefinanceinstitute.com/resources/capital-markets/stochastic-rsi-stochrsi/)].
How to Calculate the Stochastic RSI
-----Cryptonews AD----->>> <<<-----Cryptonews AD-----
To calculate the Stochastic RSI, you first need to calculate the RSI values over a specified period. Once you have the RSI values, you can apply the Stochastic oscillator formula to them. The formula for the Stochastic RSI involves comparing the RSI’s current value to its highest and lowest values over a given lookback period.
How to Read the Stochastic RSI
The Stochastic RSI oscillates between 0 and 1 (or 0 and 100 on some charting platforms). Similar to the Stochastic Oscillator, readings above 0.8 (or 80) are considered overbought, indicating a potential reversal or pullback. Conversely, readings below 0.2 (or 20) suggest oversold conditions, signaling a possible upward price movement[[2](https://www.investopedia.com/terms/s/stochrsi.asp)][[6](https://www.investopedia.com/ask/answers/031315/how-do-i-build-profitable-strategy-when-spotting-stochrsi-pattern.asp)].
However, it’s important to note that overbought and oversold conditions alone do not guarantee immediate reversals. Strong trends can persist in these conditions for extended periods. Therefore, it’s crucial to consider additional factors and wait for confirmation before making trading decisions.
Drawbacks of the Stochastic RSI
While the Stochastic RSI is a valuable indicator, it has certain limitations. One drawback is that it may generate false signals during periods of low volatility or when a security is in a prolonged trending phase. Additionally, the Stochastic RSI, like any technical indicator, should be used in conjunction with other tools and analysis techniques to increase the probability of accurate predictions[[3](https://commodity.com/technical-analysis/stochastic-rsi/)][[4](https://corporatefinanceinstitute.com/resources/capital-markets/stochastic-rsi-stochrsi/)].
In conclusion, the Stochastic RSI is a powerful indicator that combines the strengths of the Stochastic Oscillator and the RSI. By applying the Stochastic formula to the RSI values, it provides traders with a more refined tool to assess market strength and identify potential reversal points. However, it’s essential to interpret the Stochastic RSI in conjunction with other technical indicators and market analysis techniques for more reliable trading decisions.


