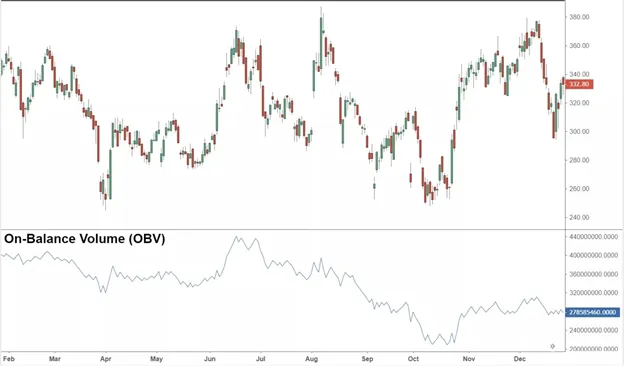
On-balance volume (OBV) is a widely used technical trading indicator that harnesses the power of volume flow to predict changes in stock price. Developed by Joseph Granville and introduced in 1963, OBV has become a popular tool among traders and investors for identifying potential bullish or bearish market conditions [1][2][3][4][5][6].
Understanding On-Balance Volume (OBV)
The concept behind OBV revolves around the belief that volume is a driving force in the financial markets. Granville, the creator of OBV, developed the indicator with the goal of projecting major market moves by analyzing volume changes [2]. He described the predictions generated by OBV as “a spring being wound tightly,” suggesting that when volume increases sharply without a significant change in the stock’s price, the price will eventually experience a substantial upward or downward movement [1].
OBV measures positive and negative volume flow by accumulating volume based on whether the price closes higher or lower than the previous close. When the closing price is higher than the previous close, the volume is added to the OBV; if the closing price is lower, the volume is subtracted from the OBV. This cumulative approach allows the OBV line to depict the overall buying or selling pressure in the market [1][6].
-----Cryptonews AD----->>>Sign up for a Bybit account and claim exclusive rewards from the Bybit referral program! Plus, claim up to 6,045 USDT bonus at . https://www.bybit.com/invite?ref=PAR8BE
<<<-----Cryptonews AD-----
Interpreting OBV Signals
Traders and investors use OBV to gain insights into market sentiment and to identify potential trading opportunities. By comparing the OBV line with price action, it is possible to generate actionable signals and confirm trends [5][6].
One of the key advantages of OBV over traditional volume histograms is its ability to provide more meaningful signals. OBV takes into account the relationship between price bars and volume, allowing for a clearer assessment of market dynamics. Convergence between OBV and price action suggests a reliable directional signal, while divergence indicates conflicting market forces [5].
OBV can be used in various ways to enhance trading strategies. Some common techniques include using OBV to confirm price trends, identify potential trend reversals, and spot bullish or bearish divergences. Additionally, OBV can be combined with other technical indicators to strengthen trading decisions and improve overall accuracy [4][5].
Applying OBV in Practice
To illustrate the application of OBV, let’s consider an example. Suppose an investor is analyzing a stock and observes a significant increase in OBV accompanied by a minimal change in price. This scenario suggests that volume is surging despite the lack of a corresponding price movement. According to Granville’s theory, this could indicate a forthcoming price “spring” in either an upward or downward direction. The investor may interpret this as a potential signal to prepare for a significant price move and adjust their trading strategy accordingly [2].
It is important to note that while OBV can provide valuable insights, it is not infallible and should be used in conjunction with other technical and fundamental analysis tools. Traders should also consider factors such as market conditions, news events, and risk management strategies when making trading decisions [4].
On-balance volume (OBV) is a powerful momentum trading indicator that utilizes volume flow to predict changes in stock price. Developed by Joseph Granville, OBV has gained widespread popularity among traders and investors for its ability to identify market sentiment and generate actionable signals. By analyzing the relationship between volume and price action, OBV provides insights into potential bullish or bearish market conditions. However, like any technical indicator, OBV should be used in conjunction with other analysis techniques and risk management strategies for more robust trading decisions [1][4][5][6].


