
Key Takeaways Fidelity documents explicit “rotation from BTC to gold”. BTC cumulative ETP flows declined from $61.5B peak to $54.5B. […]
The post Capital Fled Bitcoin for Gold: Fidelity Says It Is Coming Back appeared first on Coindoo.
Key Takeaways
- Fidelity documents explicit “rotation from BTC to gold”.
- BTC cumulative ETP flows declined from $61.5B peak to $54.5B.
- Since the U.S.-Iran conflict began: BTC +2.2%, Gold -11%, S&P 500 -4.4%.
- COVID onset 60-day window: BTC +21%, Gold and S&P 500 both trailed.
What the Flow Data Shows
Jurrien Timmer, director of global macro at Fidelity Investments, an $8 trillion asset manager, published weekly ETP flow data through March 30, 2026, showing one of the clearest capital rotation signals visible in the past two years.
According to Timmer, Bitcoin cumulative ETP flows, which had risen from near zero in January 2024 to a peak of approximately $61.5 billion by mid-2025, have declined to $54.5 billion. Gold and silver ETP flows, which were negative or negligible through most of 2024, have risen to $27.4 billion. The chart labels the shift explicitly: rotation from BTC to gold.


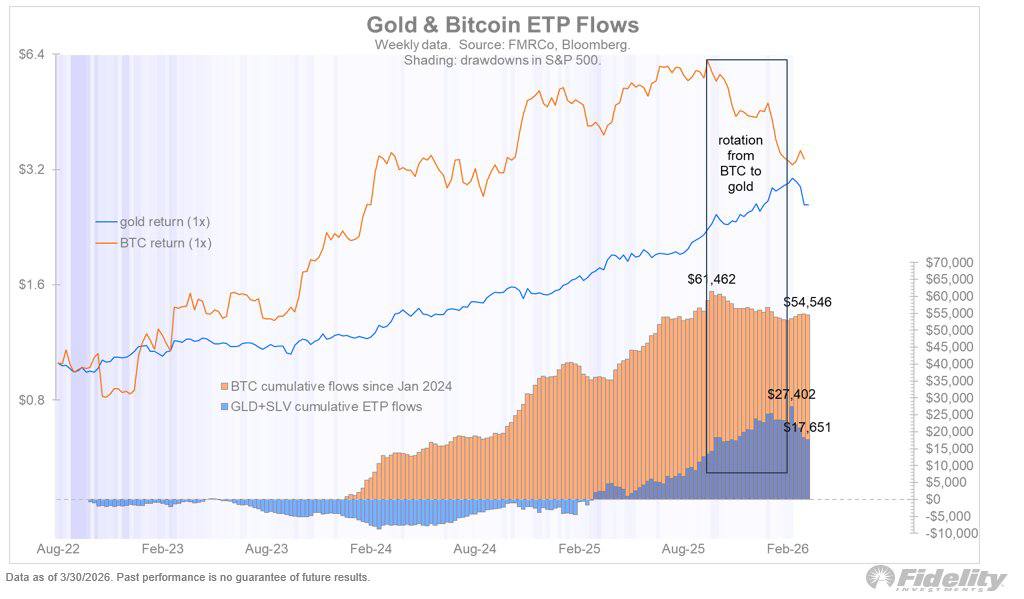
The timing aligns with the onset of the U.S.-Iran conflict and the broader risk-off environment that characterized the market since late 2025. Investors seeking safety moved toward the asset with the longer safe-haven track record, and the flow data confirms this was not retail noise but a sustained institutional reallocation at scale.
What Fidelity’s chart also shows is that the rotation appears to be reversing. Bitcoin’s return line and gold’s return line, which diverged sharply during the rotation period, have now converged at approximately the same level. Capital that rotated from BTC into gold at the top of Bitcoin’s cycle is beginning to find its way back. The $8 trillion manager is not making a price prediction. It is documenting a flow pattern, and the direction of that pattern has changed.
However, these data do not show the full picture. Flows into ETF and ETP products represent only part of the market, while gold is also being purchased by central banks and through the physical market, which is not reflected in these figures. In the early stages of every crisis, markets often see sharp moves driven by short covering, which can temporarily push prices higher and create the impression of a trend reversal. If geopolitical tensions escalate or interest rates remain high, capital could move back into gold and the U.S. dollar. For that reason, it is still too early to say whether this is a new trend or simply a short-term move within a larger cycle.
What History Says About the Reversal
That reversal is consistent with what Mercado Bitcoin Research found when it analyzed 60-day windows following major economic and geopolitical shocks, which is precisely why the Fidelity flow data and the historical crisis data belong in the same conversation.
According to Mercado’s report, shared by Coindesk, on the 60 days following the April 2024 Trump tariff announcement, Bitcoin returned 24% while gold returned 8% and the S&P 500 returned 4%. In the 60 days following the COVID-19 onset in March 2020, Bitcoin returned 21% while gold and the S&P 500 both trailed. In both cases the asset that experienced the most dramatic initial outflow, Bitcoin, produced the strongest recovery once the panic selling exhausted itself.
The current numbers make that pattern visible in real time. Since the U.S.-Iran conflict began, Bitcoin is up 2.2%, from approximately $65,800 to $67,300. Gold is down 11%. The S&P 500 is down 4.4%. Bitcoin is already the best-performing of the three inside a crisis that has not yet reached the 60-day window the historical analysis measures.

The 60-Day Window
Mercado Bitcoin Head of Research Rony Szuster frames the current moment precisely: judging Bitcoin’s crisis performance in the first days is like watching the opening minutes of a film and deciding you know the ending. Initial sell-offs for liquidity affect even Bitcoin — the asset has been sold alongside everything else in the first phase of every major shock since 2020. The Fidelity flow data is showing that phase ending. The historical data shows what has followed it.
The Fidelity chart confirms the rotation is real, institutional, and now reversing. The Mercado Bitcoin data suggests the rotation into gold may have been exactly the trade that has historically underperformed in the 60 days that follow the moment it feels most justified. Whether the current crisis produces the same pattern as 2020 and 2024 is the question neither dataset can answer until the window closes.
The information provided in this article is for educational purposes only and does not constitute financial, investment, or trading advice. Coindoo.com does not endorse or recommend any specific investment strategy or cryptocurrency. Always conduct your own research and consult with a licensed financial advisor before making any investment decisions.
The post Capital Fled Bitcoin for Gold: Fidelity Says It Is Coming Back appeared first on Coindoo.
Source: https://coindoo.com/capital-fled-bitcoin-for-gold-fidelity-says-it-is-coming-back/
More Crypto News
Check our Market Overview
Disclaimer: This article is for informational purposes only and does not constitute financial advice. Always conduct your own research (DYOR).


