

That shelf has carried weight since July 15, with repeated trading around the same area building a well-established supply zone. […]
The post Ethereum Rebounds, but a Massive Resistance Looms appeared first on Coindoo.
That shelf has carried weight since July 15, with repeated trading around the same area building a well-established supply zone. ETH has now reached it, and today’s daily close will decide whether the rebound counts as a successful retest.
Key Takeaways
- Price reached the expected horizontal resistance identified in our previous Ethereum analysis.
- The harder test sits near $1,950.
- Ethereum wallets have crossed 200 million.
- Central-bank decisions could disrupt the setup.
The Retest Depends on Today’s Close
For the setup to improve, Ethereum needs to finish the session above both the horizontal shelf and the Fibonacci level beneath it.
Closing above the shelf would show buyers absorbing the supply built there since mid-July, and would confirm Tuesday’s defence of $1,870 as something more durable than a short-lived reaction.


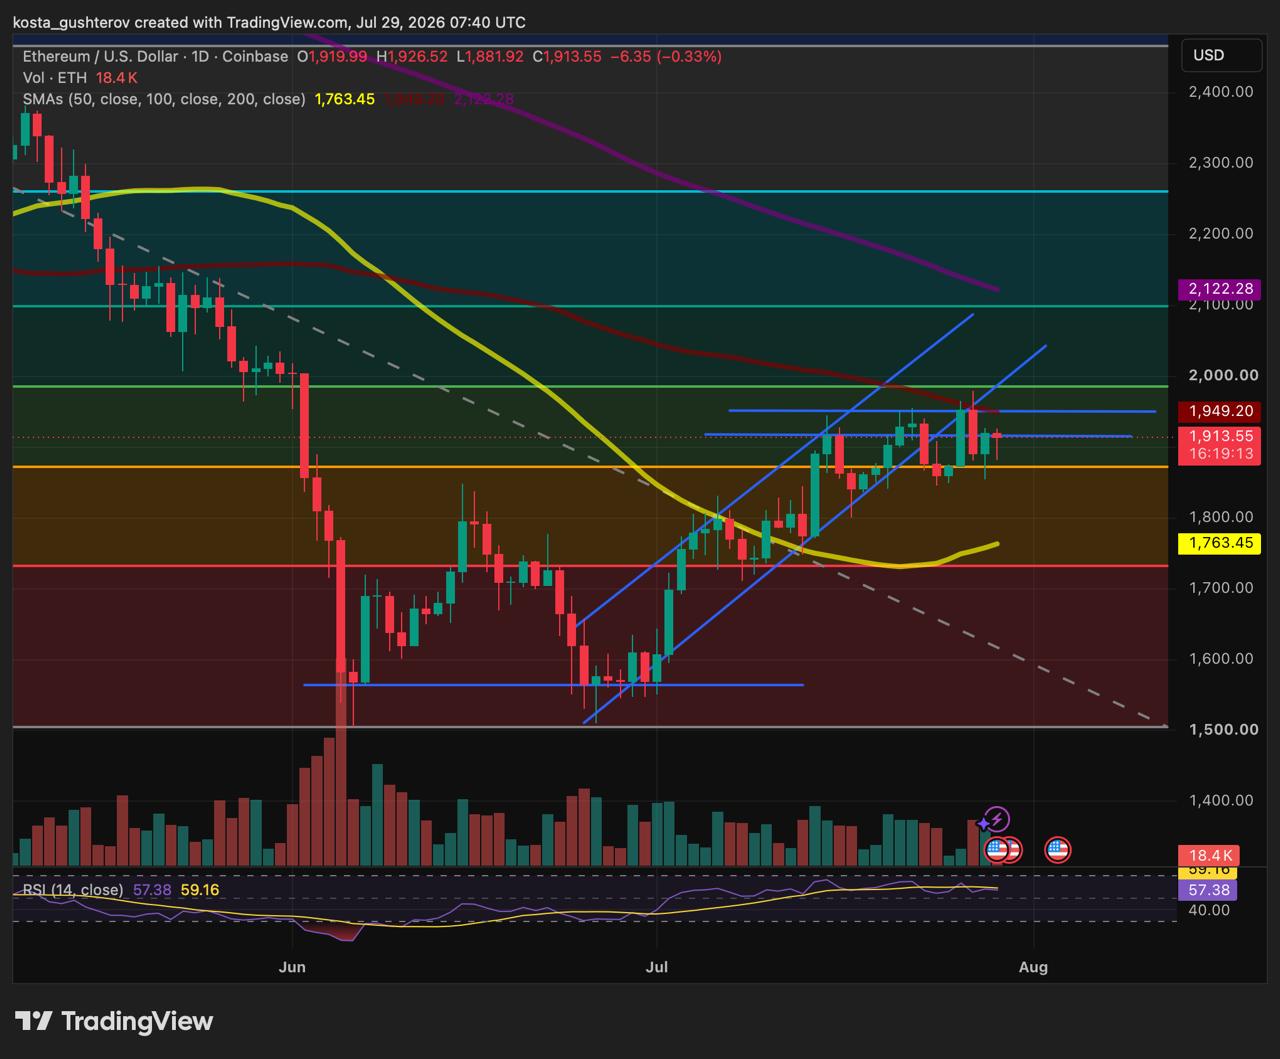
A close back under the shelf while price holds above $1,870 would leave the setup unresolved. Dropping beneath the Fibonacci level would weaken it decisively and reopen a way for a move towards $1,800.
Daily RSI stands near 57, above its signal line. Momentum has improved while staying well short of stretched, leaving room for another advance on confirmation.
The Harder Resistance Sits at $1,950
Clearing the current shelf brings the next test into view.
The $1,950 area combines a second horizontal level with the 100-day simple moving average. The horizontal level reflects supply from earlier trading, while the moving average serves as a widely followed medium-term trend gauge.
That overlap gives the zone more weight than either component would carry alone. Buyers would need to absorb existing sell orders while pushing ETH back above an average that has stayed overhead throughout the recovery.
An intraday spike through $1,950 would be encouraging. A close above it, held into the following session, would provide the stronger evidence that this is more than a relief bounce.
The June Channel and $2,000 Form Another Barrier
Above $1,950, attention shifts to the 0.5 Fibonacci retracement at $1,985, where the lower boundary of Ethereum’s June ascending channel also sits.
That channel supported ETH through its earlier recovery until price broke beneath it on July 23. Former support approached from below tends to attract sellers.
The psychological level at $2,000 sits immediately above, concentrating the barrier between $1,985 and $2,000.
Ethereum began its broader decline towards $1,500 from this same region on June 2. Traders who bought before that drop may treat another visit as a chance to reduce exposure, adding supply to an already visible zone. Clearing the whole band in a single move would be a tall order, and a pause or rejection near $2,000 would fit the pattern even after a successful break of $1,950.
Wallet Growth Helps Support the Longer-Term Picture
The defence of $1,870 comes against a broader expansion in Ethereum’s holder base. Santiment data shows the network crossed 200 million non-empty wallets for the first time during the past two weeks.

The figure covers addresses, not people, since one individual, exchange or institution may control several. What it does show is that more wallets are holding an ETH balance even after the recent decline.
A growing base of balance-holding addresses can help the market absorb supply during pullbacks. Nothing in the data proves those wallets bought at $1,870, though it offers a structural reason why selling around the Fibonacci level met demand instead of cascading.
Holder growth carries no breakout signal on its own. Its relevance grows if ETH converts the current shelf into support and then challenges $1,950.
Days of Macro Risk
Ethereum’s technical test arrives inside a tightly packed sequence of central-bank events.
The Federal Reserve decision lands on 29 July. An unchanged rate is the expected outcome and is largely priced in, which leaves the market sensitive to the tone of the accompanying guidance. A hawkish message could lift the dollar and bond yields, weakening demand for risk assets and turning any break above $1,950 into a failed one.
Attention then shifts to the Bank of Japan across Thursday and Friday. As covered in our analysis of how Japan’s rate path affects crypto, any signal of faster tightening could strengthen the yen and pressure the carry trades that fund positions across equities and digital assets.
Friday’s US economic releases close the week. A favourable macro response would give buyers a better chance of clearing $1,950 and testing the $1,985 to $2,000 region, while a hawkish surprise could undo an otherwise sound technical breakout.
The Levels That Matter Now
ETH sits below both its 100-day and 200-day moving averages, so the advance remains a recovery inside a weak broader structure.
- Upside scenario: A close above the current shelf, held above $1,870, opens the $1,950 test. Clearing the 100-day average from there exposes the $1,985 to $2,000 band, where the June channel and the psychological level converge.
- Rejection scenario: Failure at the current shelf puts $1,870 back under pressure. Losing that level brings $1,800 into play.
The chart might only change character if buyers reclaim $1,950 and prove they can hold the cluster above it. Everything below that is range behaviour inside a downtrend, and three central-bank events over the next three days could decide it either way.
- Disclaimer: This article is for informational purposes only and does not constitute financial or investment advice. Technical levels may fail, particularly around major central-bank and economic announcements.
- Methodology: The analysis uses the ETH/USD daily chart, Fibonacci retracement levels, horizontal trading zones, the 100-day and 200-day simple moving averages, RSI and Santiment holder-count data through July 28.
The post Ethereum Rebounds, but a Massive Resistance Looms appeared first on Coindoo.
Source: https://coindoo.com/ethereum-rebounds-but-a-massive-resistance-looms/


More Crypto News
Check our Market Overview
Disclaimer: This article is for informational purposes only and does not constitute financial advice. Always conduct your own research (DYOR).