

Key Takeaways ETF outflows continued into a third week. The next support sits near $52. Recovery requires a move above […]
The post Why HYPE’s Drop Below $57 Matters for Traders appeared first on Coindoo.
Key Takeaways
- ETF outflows continued into a third week.
- The next support sits near $52.
- Recovery requires a move above $64.
- Grayscale sees longer-term valuation appeal.
Fund demand weakened alongside it. Grayscale published a constructive valuation case the same week, built on Hyperliquid’s projected 2027 earnings, leaving a gap between what the model implies and how investors are currently positioned.
The $57 Zone Has Turned Into Resistance
HYPE spent much of late June and mid-July trading around $57, giving the area more structural weight than the 0.382 Fibonacci level alone. The zone also contains the 100-day moving average near $57.30, which previously acted as support.
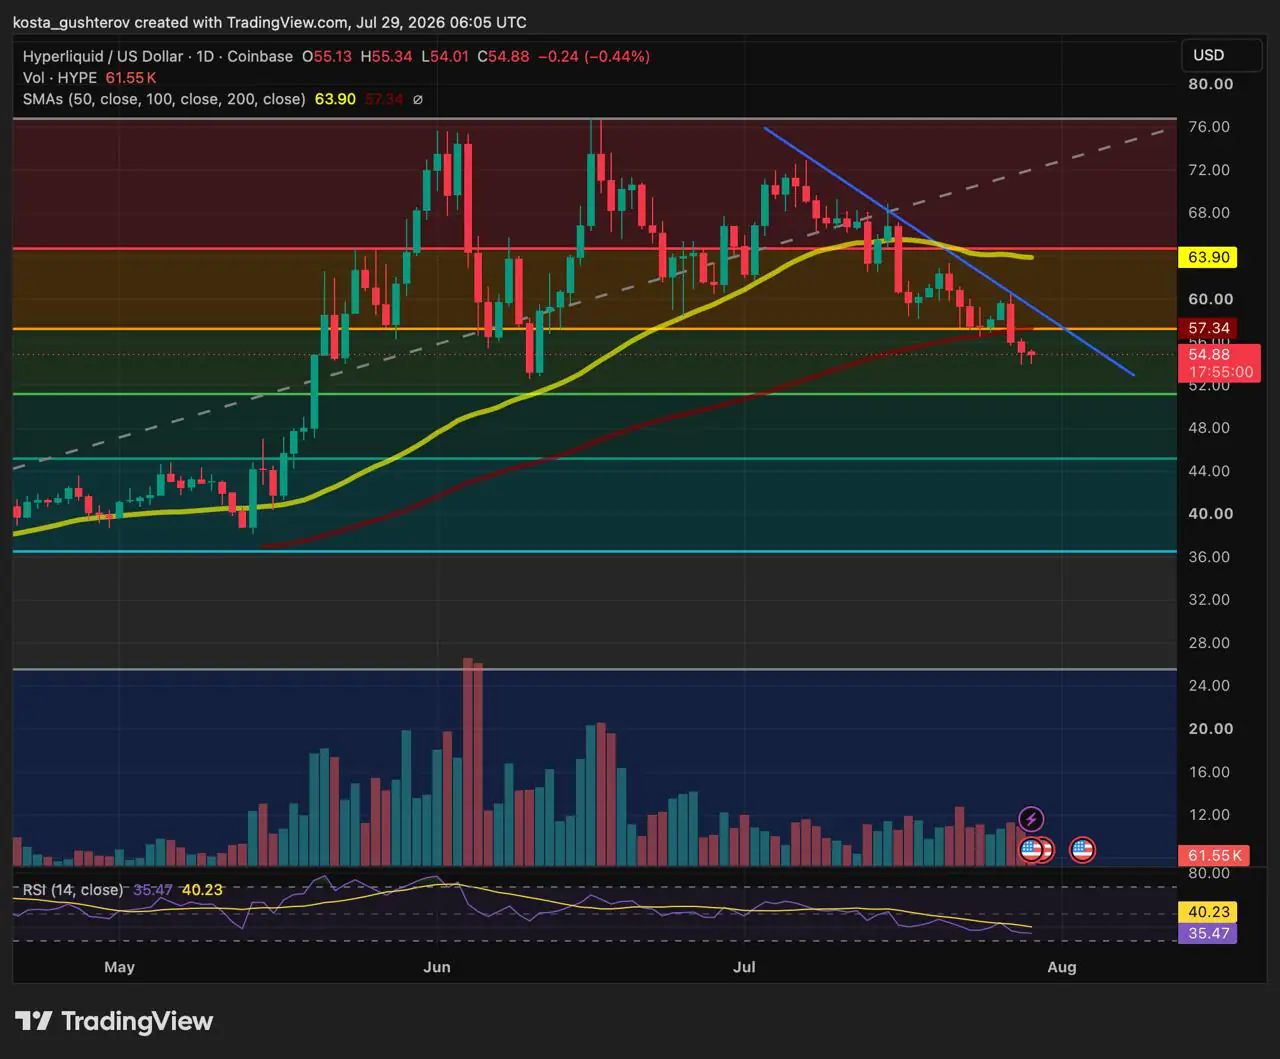
That cluster now sits overhead. Traders who bought around $57 may use a rebound to reduce losses, while sellers can treat the former support as a new entry area.


The descending trendline from the July highs adds further pressure, and the 50-day moving average at $64 sits above it.
ETF Flows Have Reversed Since Mid-July
The weekly ETF data from SoSoValue initially showed uninterrupted demand. Every completed reading from May 15 through July 10 was positive, including $57.19 million for the week ending May 29 and a peak of $111.36 million by June 26.
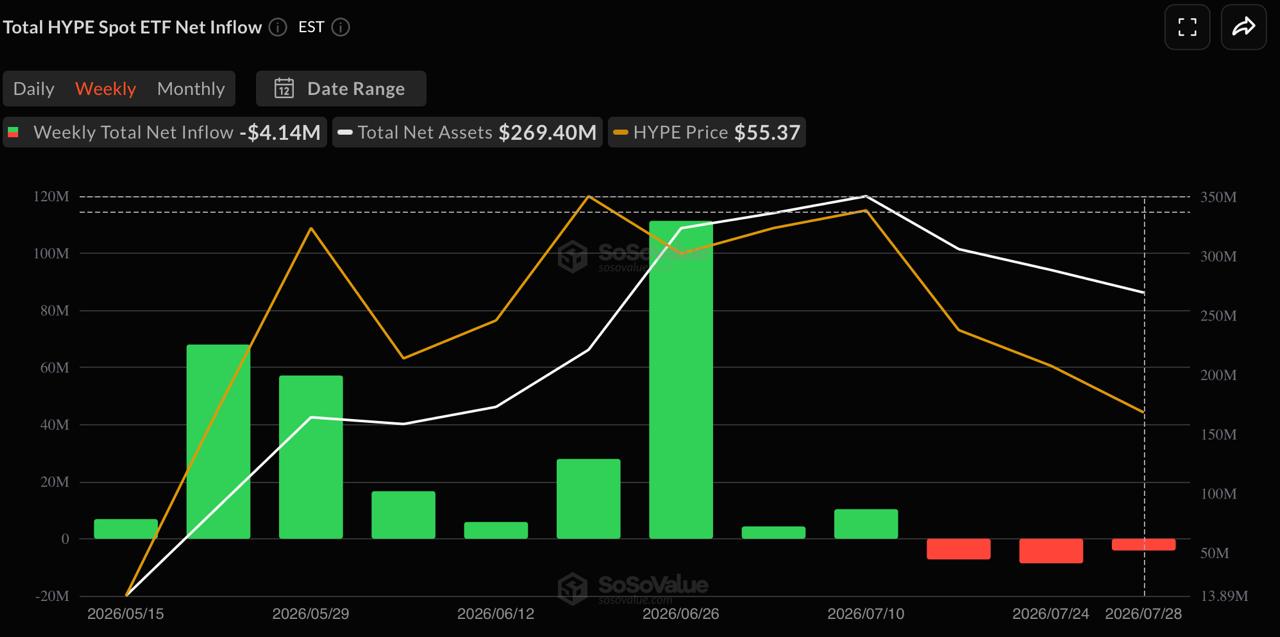
Another $10.36 million entered during the week ending July 10, then the sequence turned negative. Net outflows reached $7.26 million by July 17 and $8.61 million during the week ending July 24.
The weakness has continued into the current week, with withdrawals of $2.89 million on July 27 and $1.24 million on July 28, bringing the partial weekly total to $4.14 million.
Those red readings are modest against the inflows recorded in May and June. What gives them weight is the timing: ETF demand faded in the same window that HYPE lost $57 and slipped under its 100-day average.
Grayscale Values HYPE Through Future Earnings
In a July 28 report, Grayscale Head of Research Zach Pandl argued that HYPE should be valued using “earnings per token” instead of being treated purely as a speculative cryptocurrency.
Grayscale estimates that Hyperliquid could generate $1 billion in earnings during 2027. With circulating supply projected between 270 million and 310 million HYPE, that equals $3.25 to $3.75 in earnings per token.
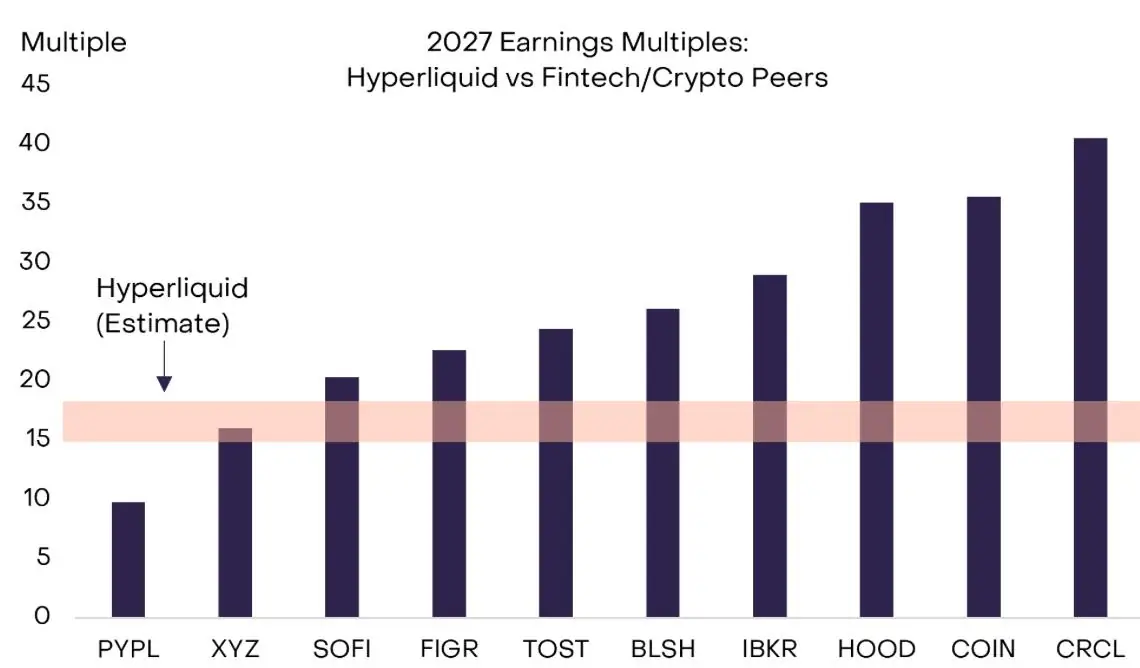
At a HYPE price near $54, those estimates produce a forward multiple of 15 to 18 times earnings. Pandl compared that with a range of 20 to 40 times for many listed fintech and crypto companies, arguing that HYPE still looks relatively inexpensive.
The calculation depends on Hyperliquid sustaining strong trading activity and fee revenue. Any shortfall would reduce earnings per token and lift the effective multiple.
Supply growth is the other variable. Contributor allocations unlock at roughly 550,000 HYPE each month, and faster circulation growth would divide future earnings across more tokens while adding selling pressure.

Potential Moves
Upside scenario
A daily close between $57 and $57.3 would retake the broken Fibonacci level and the 100-day average, returning HYPE to its former consolidation range. That would signal stabilisation on its own. The more meaningful test is $64, where the 50-day average meets another Fibonacci level above the sequence of lower highs formed since early July. Clearing it would put price back over both averages and challenge the downtrend. ETF flows turning positive alongside either move would strengthen the case.
Downside scenario
The 0.618 Fibonacci retracement near $52 is the next support. Losing it would expose the $45 area, where the 0.786 retracement meets the base formed during April and May.
Bigger picture
A valuation model and a price chart answer different questions. Grayscale’s case can hold while HYPE trades lower for months, since forward multiples improve as price falls. The levels above determine when positioning starts agreeing with the thesis.
- Disclaimer: This article is for informational purposes only and does not constitute financial or investment advice. Technical levels, ETF flows and valuation estimates do not guarantee future performance.
- Methodology: The analysis uses the HYPE/USD daily chart dated July 29, 2026, weekly and daily ETF flow data through July 28, and the assumptions presented in Grayscale’s July 28 Hyperliquid valuation report.
The post Why HYPE’s Drop Below $57 Matters for Traders appeared first on Coindoo.
Source: https://coindoo.com/hype-drop-matters-traders/


More Crypto News
Check our Market Overview
Disclaimer: This article is for informational purposes only and does not constitute financial advice. Always conduct your own research (DYOR).