The Bitcoin price has broken the $38,000 mark and may have entered an important support zone. This important achievement could open the way up again. Currently, the question is how quickly can Bitcoin get back into the 40,000s. Could the price turn heavily bullish again in the next few weeks? Or the Bear market did not end yet? Let’s have a quick look at Bitcoin price and the equity markets.
-----Cryptonews AD----->>>

Sign up for a Bybit account and claim exclusive rewards from the Bybit referral program! Plus, claim up to 6,045 USDT bonus at . https://www.bybit.com/invite?ref=PAR8BE
<<<-----Cryptonews AD-----
Bitcoin Price breaks Resistance above $38,000
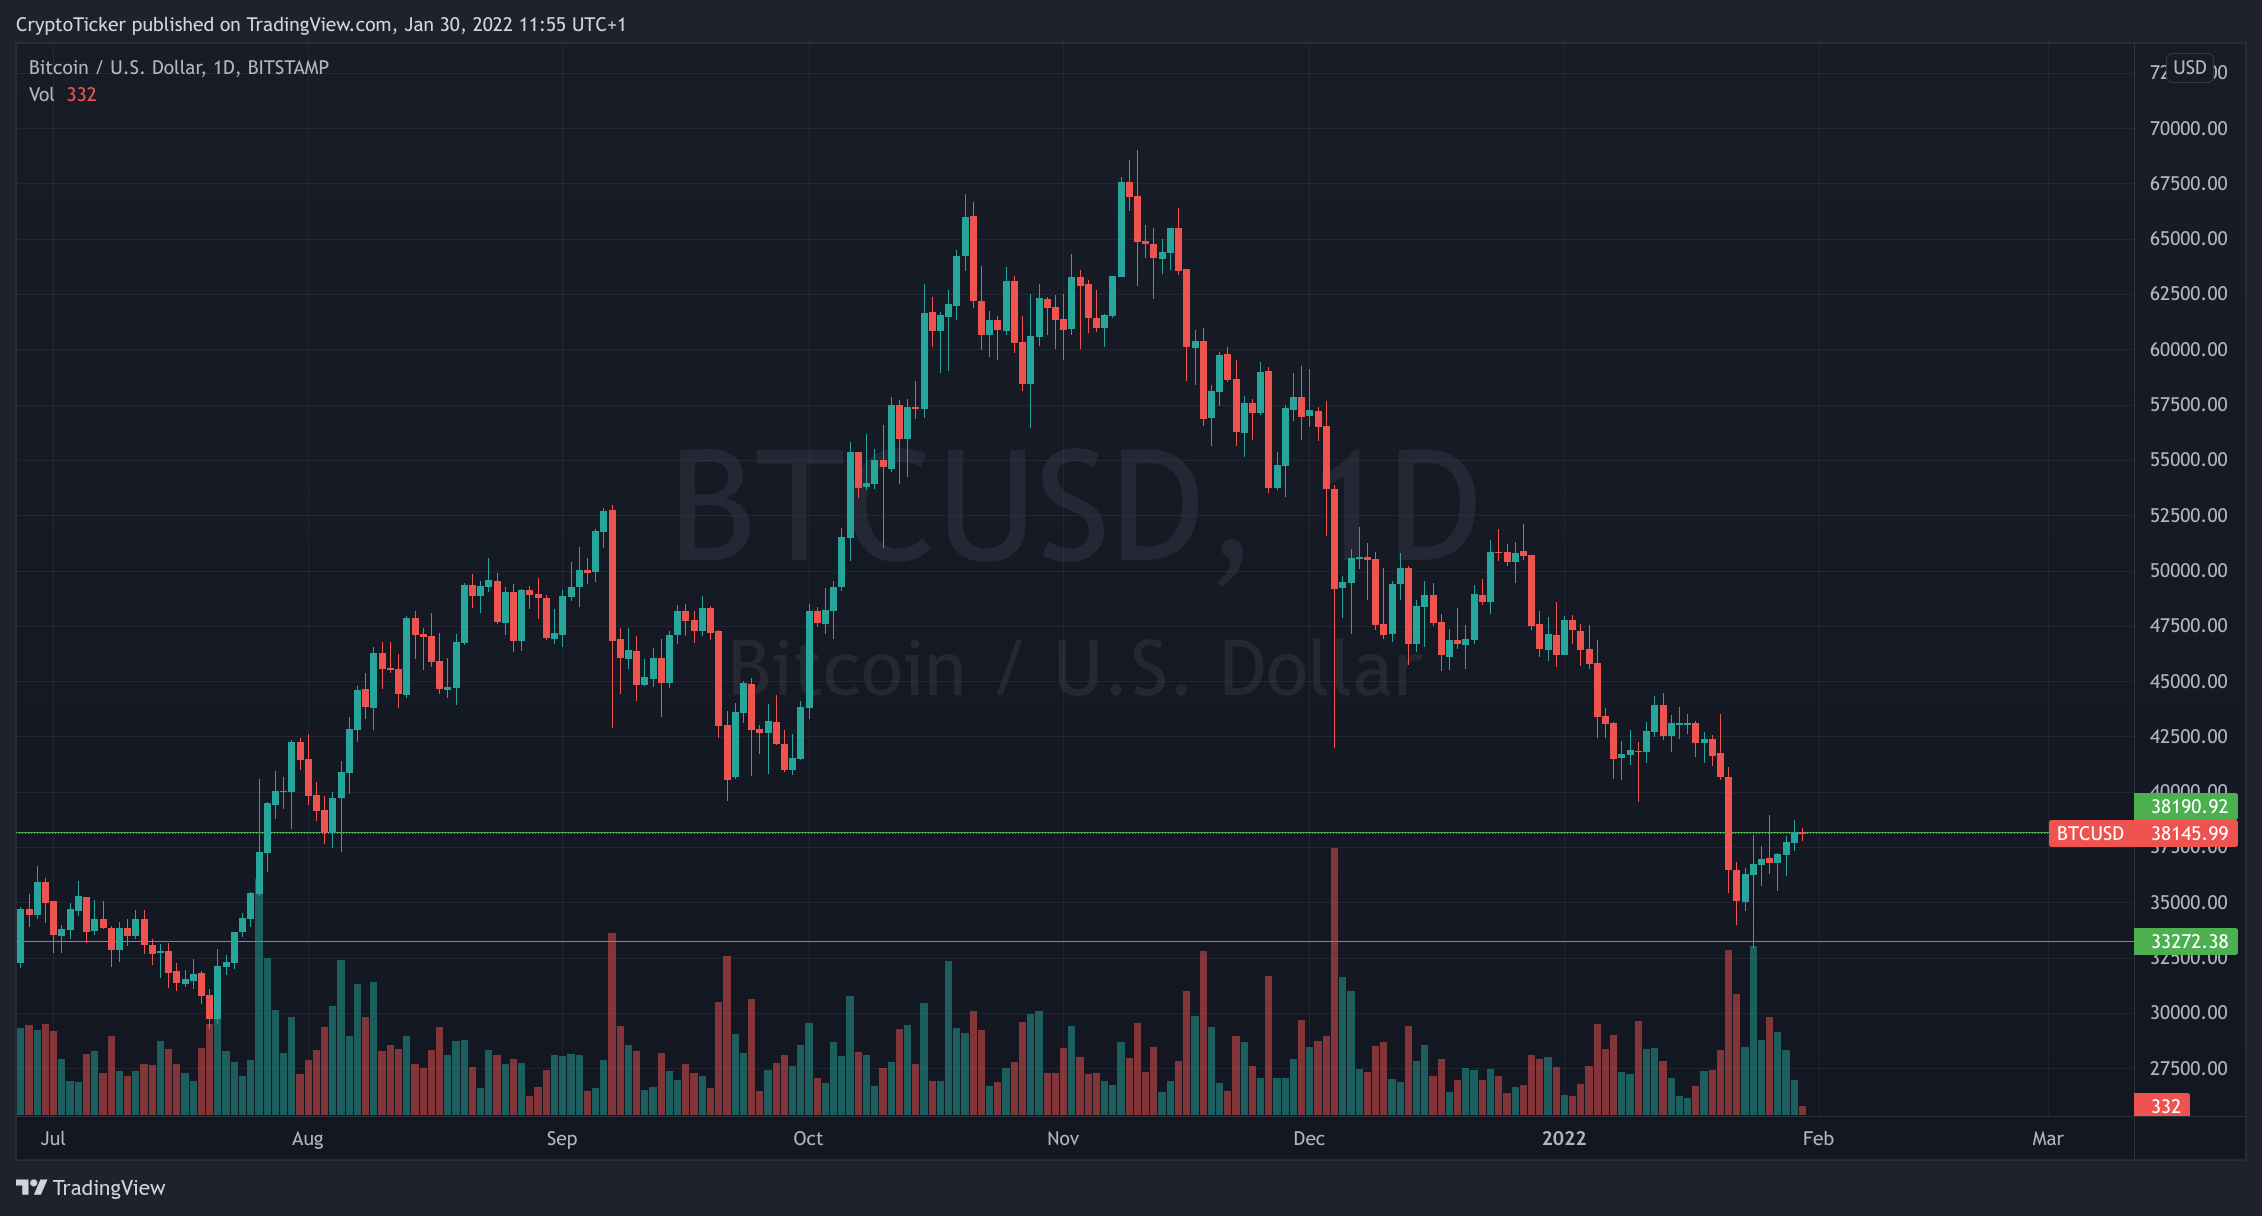
The Bitcoin price shattered from a high of 60K all the way to 33K in the past month. A week ago it fell from $43,000 in 2 days to around the bottom $33,000 at times. Stabilization progressed very slowly. The price then leveled off between $35,000 and $36,000.
In the last few days, the Bitcoin price tried to break the $38,000 mark. Bitcoin had to move down again and again. Today it is finally climbing above $38,000 and it may have entered a key support zone.
Bitcoin Price at important Resistance Level
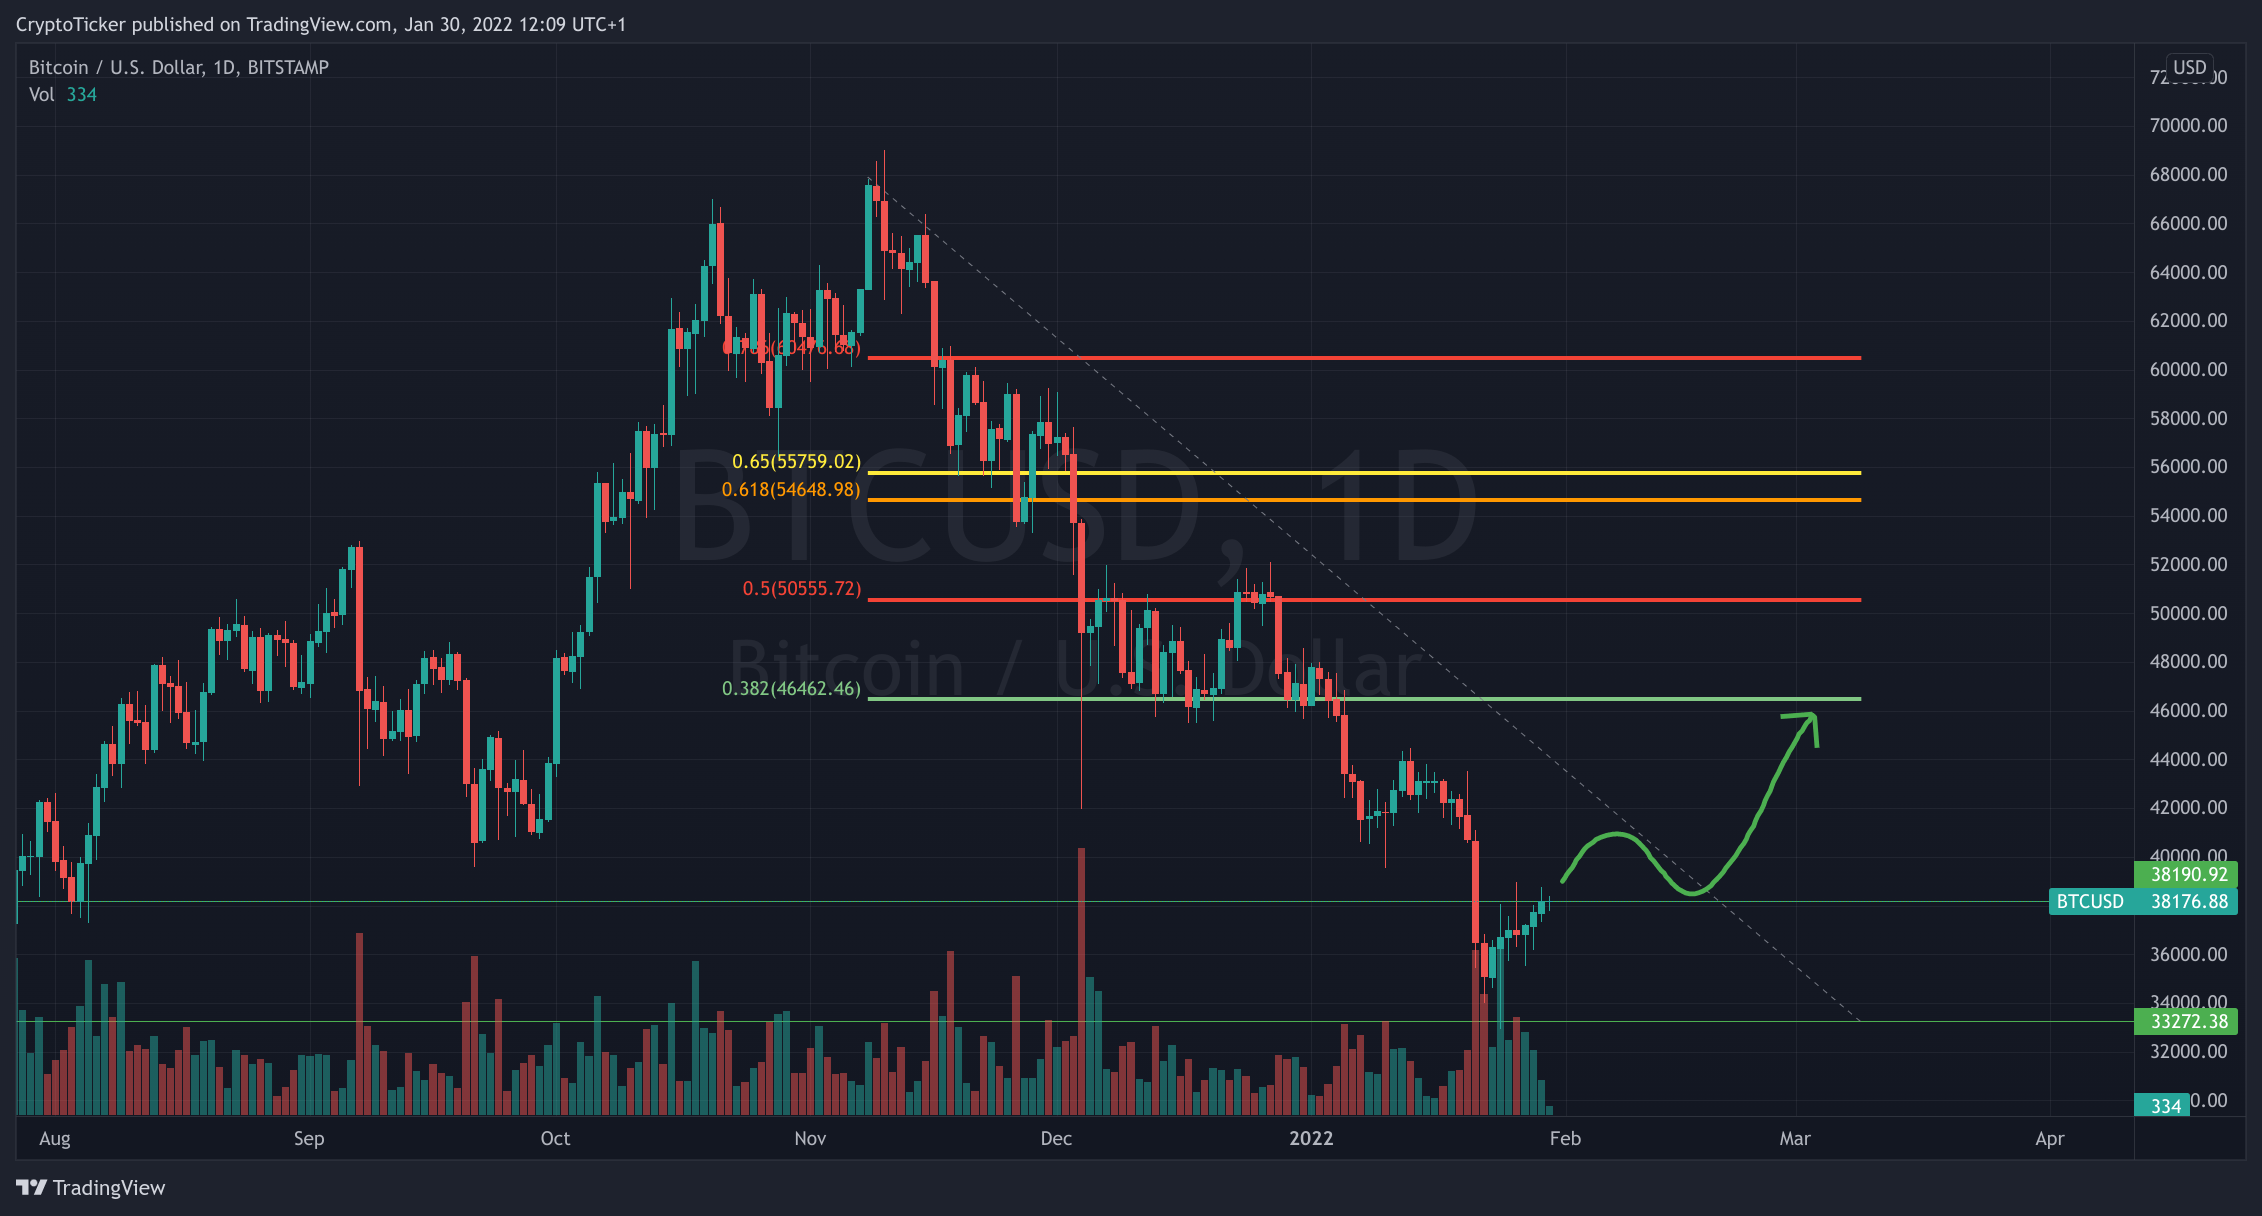
It is true that Bitcoin prices managed to break the resistance level of $38,000. However, it is crucial to keep in mind that this break might be a mere fakeout. Prices can still fall lower and reach $33,000 again. Technical traders often await prices to reach such areas to short-sell the asset with a 50% target of the low price. In order to confirm the break in the downtrend, we need prices to remain higher than $38,000 for a couple of days, or see a major green candle breaking higher.
Another important element that needs to happen is a consolidation in prices. This price breather is vital to regain the purchasing power. The Fibonacci retracement of the current crash shows that prices need to even breach a price of $47,000 to announce the end of the bear market.
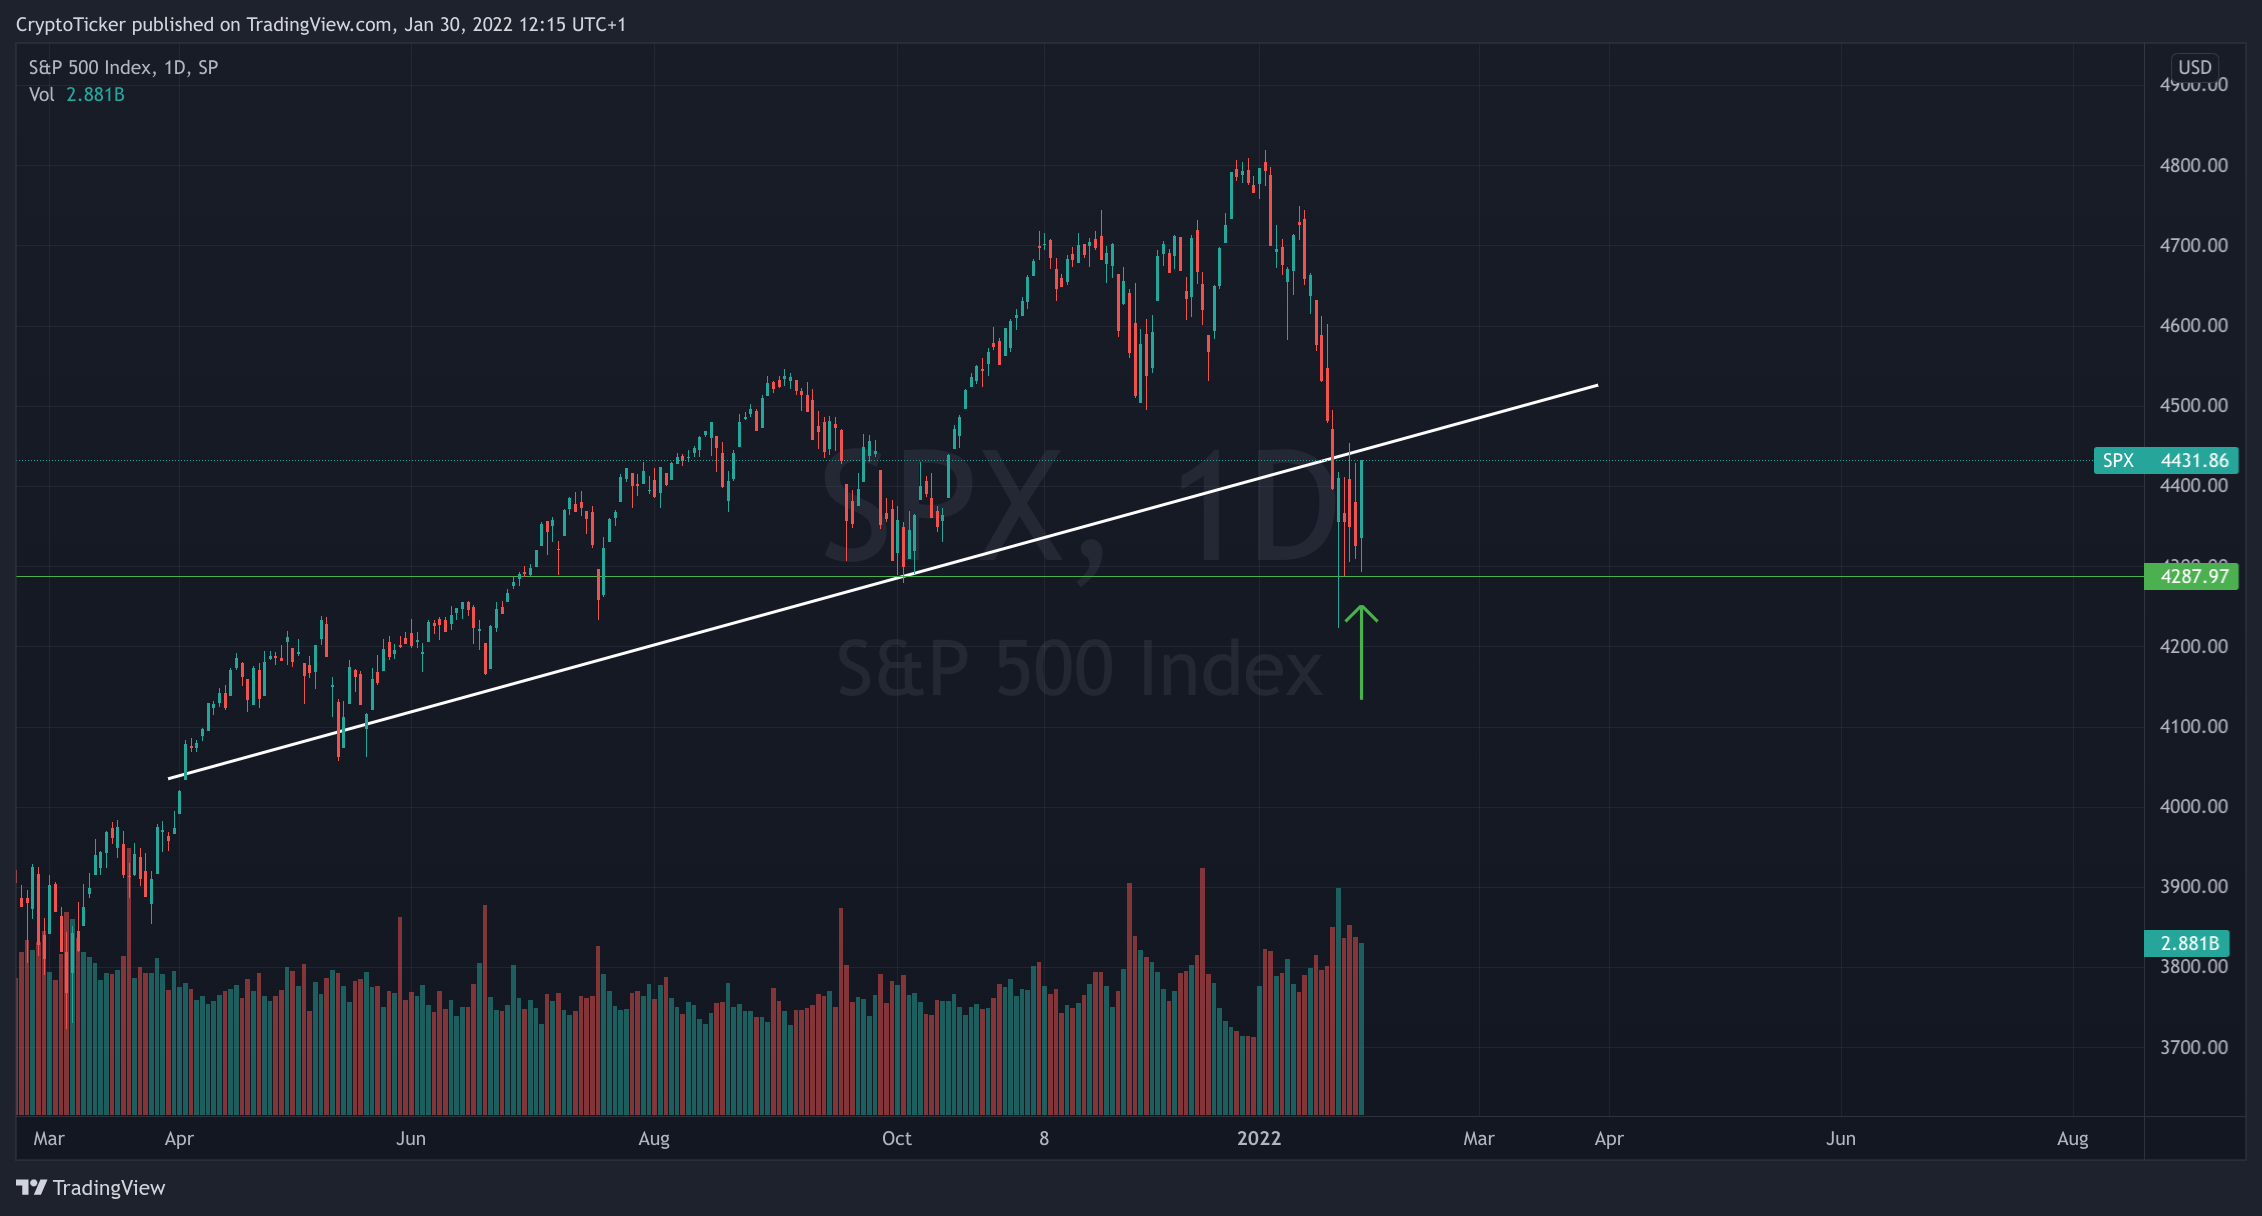
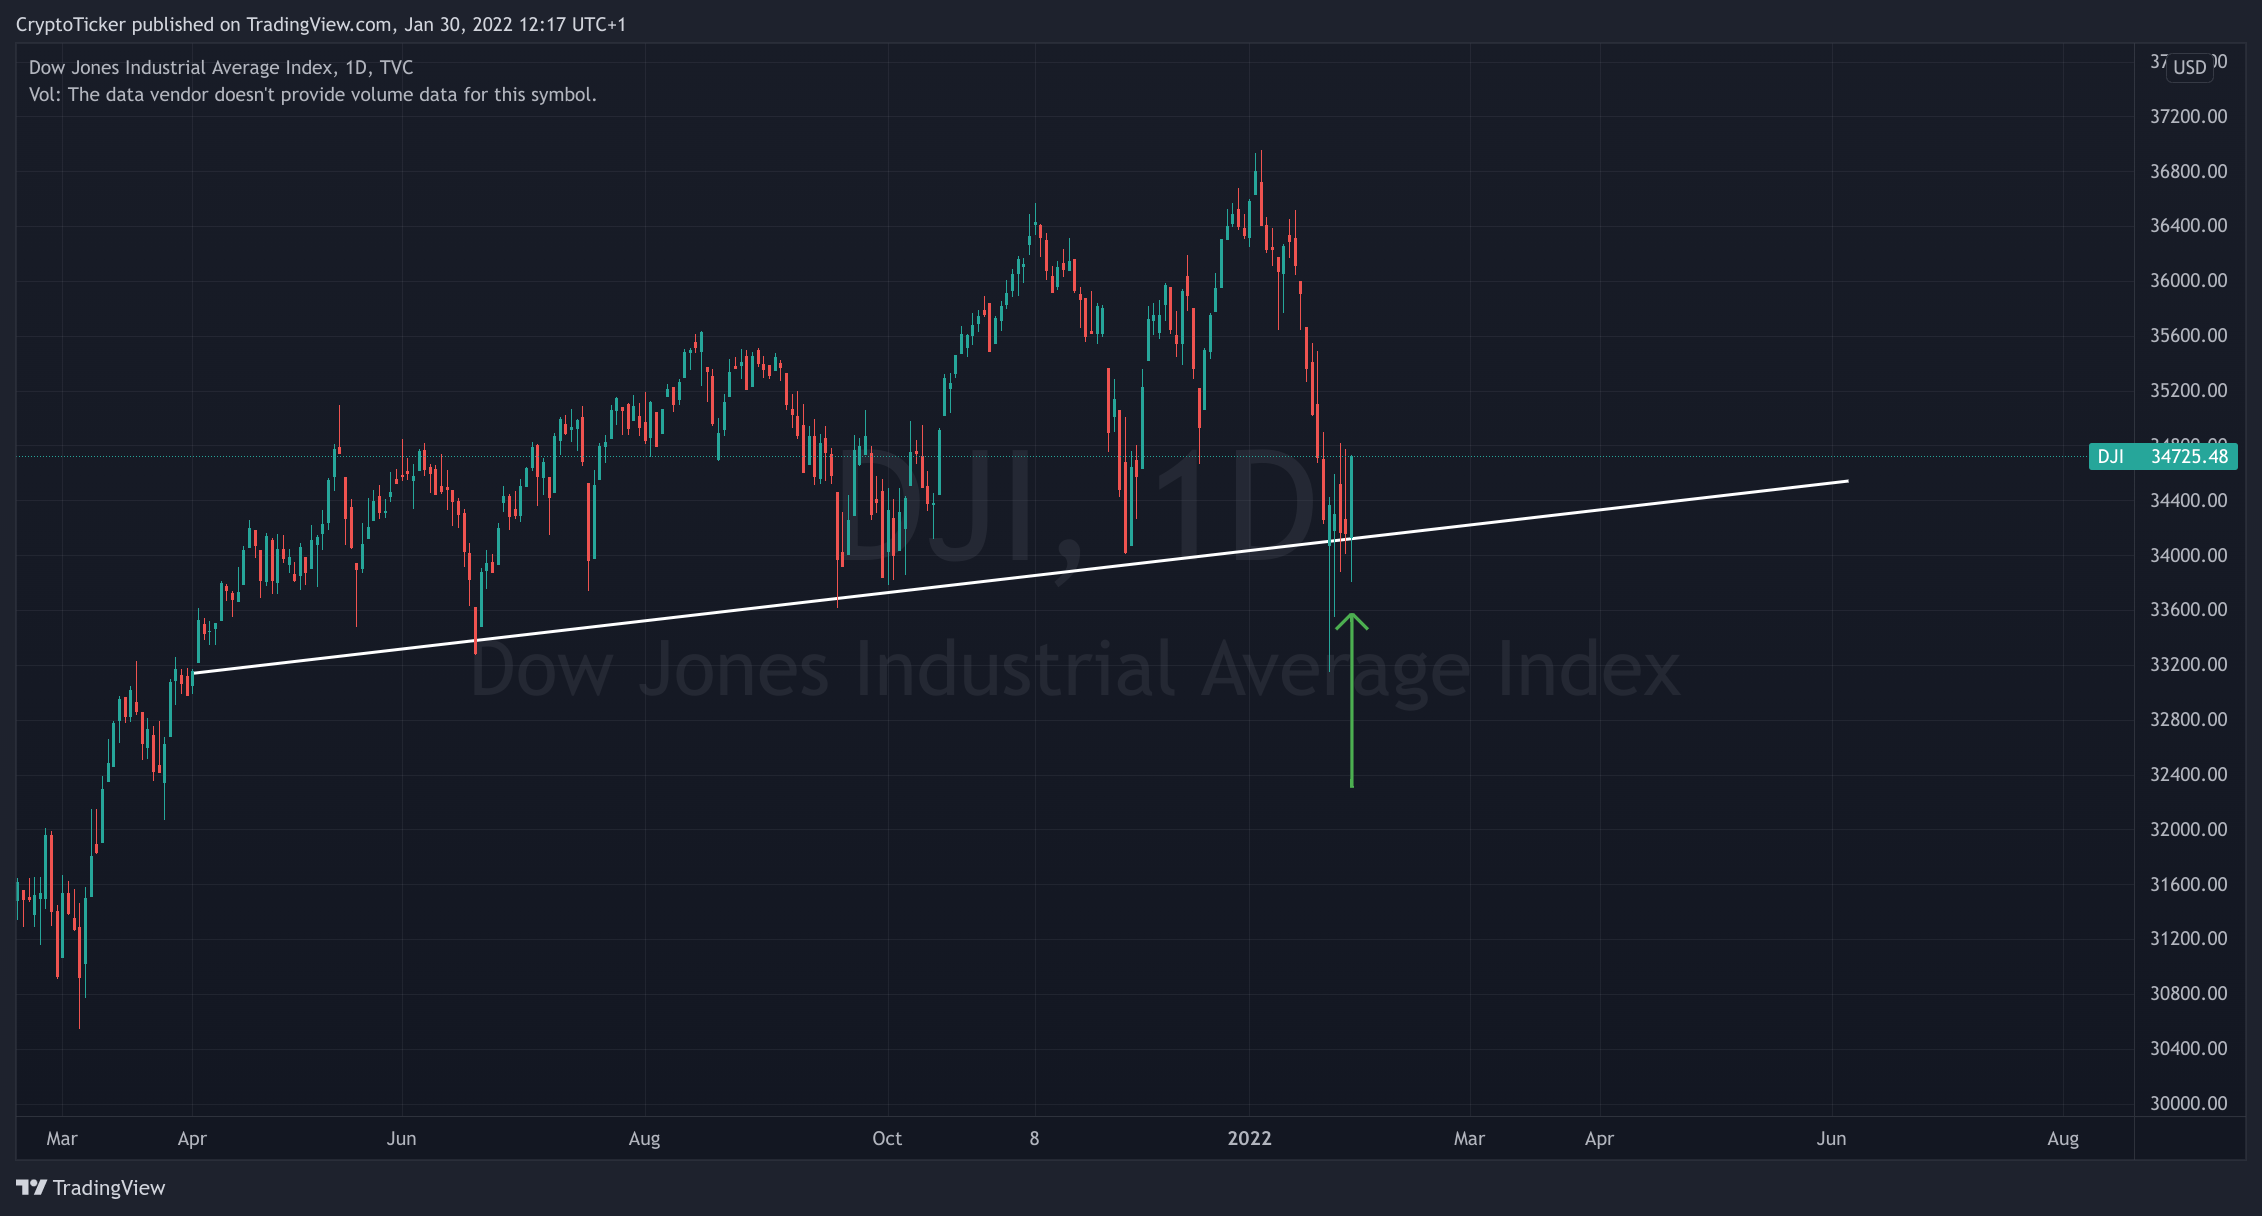
The US Equity Market is UP as well
Looking at the Dow Jones Industrial Average and the S&P index chart, we can see a strong green candle that occurred this past Friday before the market closes. In turn, the crypto market recovered as well. Since both indexes might recover from their strong support areas, the crypto market might as well go up accordingly.
If you feel like you need guidance when tackling the crypto market, you need to check out our premium area. You’ll always be up-to-date with everything happening in the crypto market. Additionally, you will receive trading ideas and professional trading support. You will also receive information about the latest crypto trends at an early stage! If you want to read more about our Premium Area, click here.
Don’t forget to follow us on Google News to keep yourself updated with the latest Price Predictions 😉

The post Bitcoin Price $BTC above 38K! Bear Market Over? Look at US Equities! appeared first on CryptoTicker.
Bitcoin Price $BTC above 38K! Bear Market Over? Look at US Equities!
Don’t miss a thing, sign up for our newsletter

 expects a $10 billion net profit! Is stablecoin the future of payments?”")

