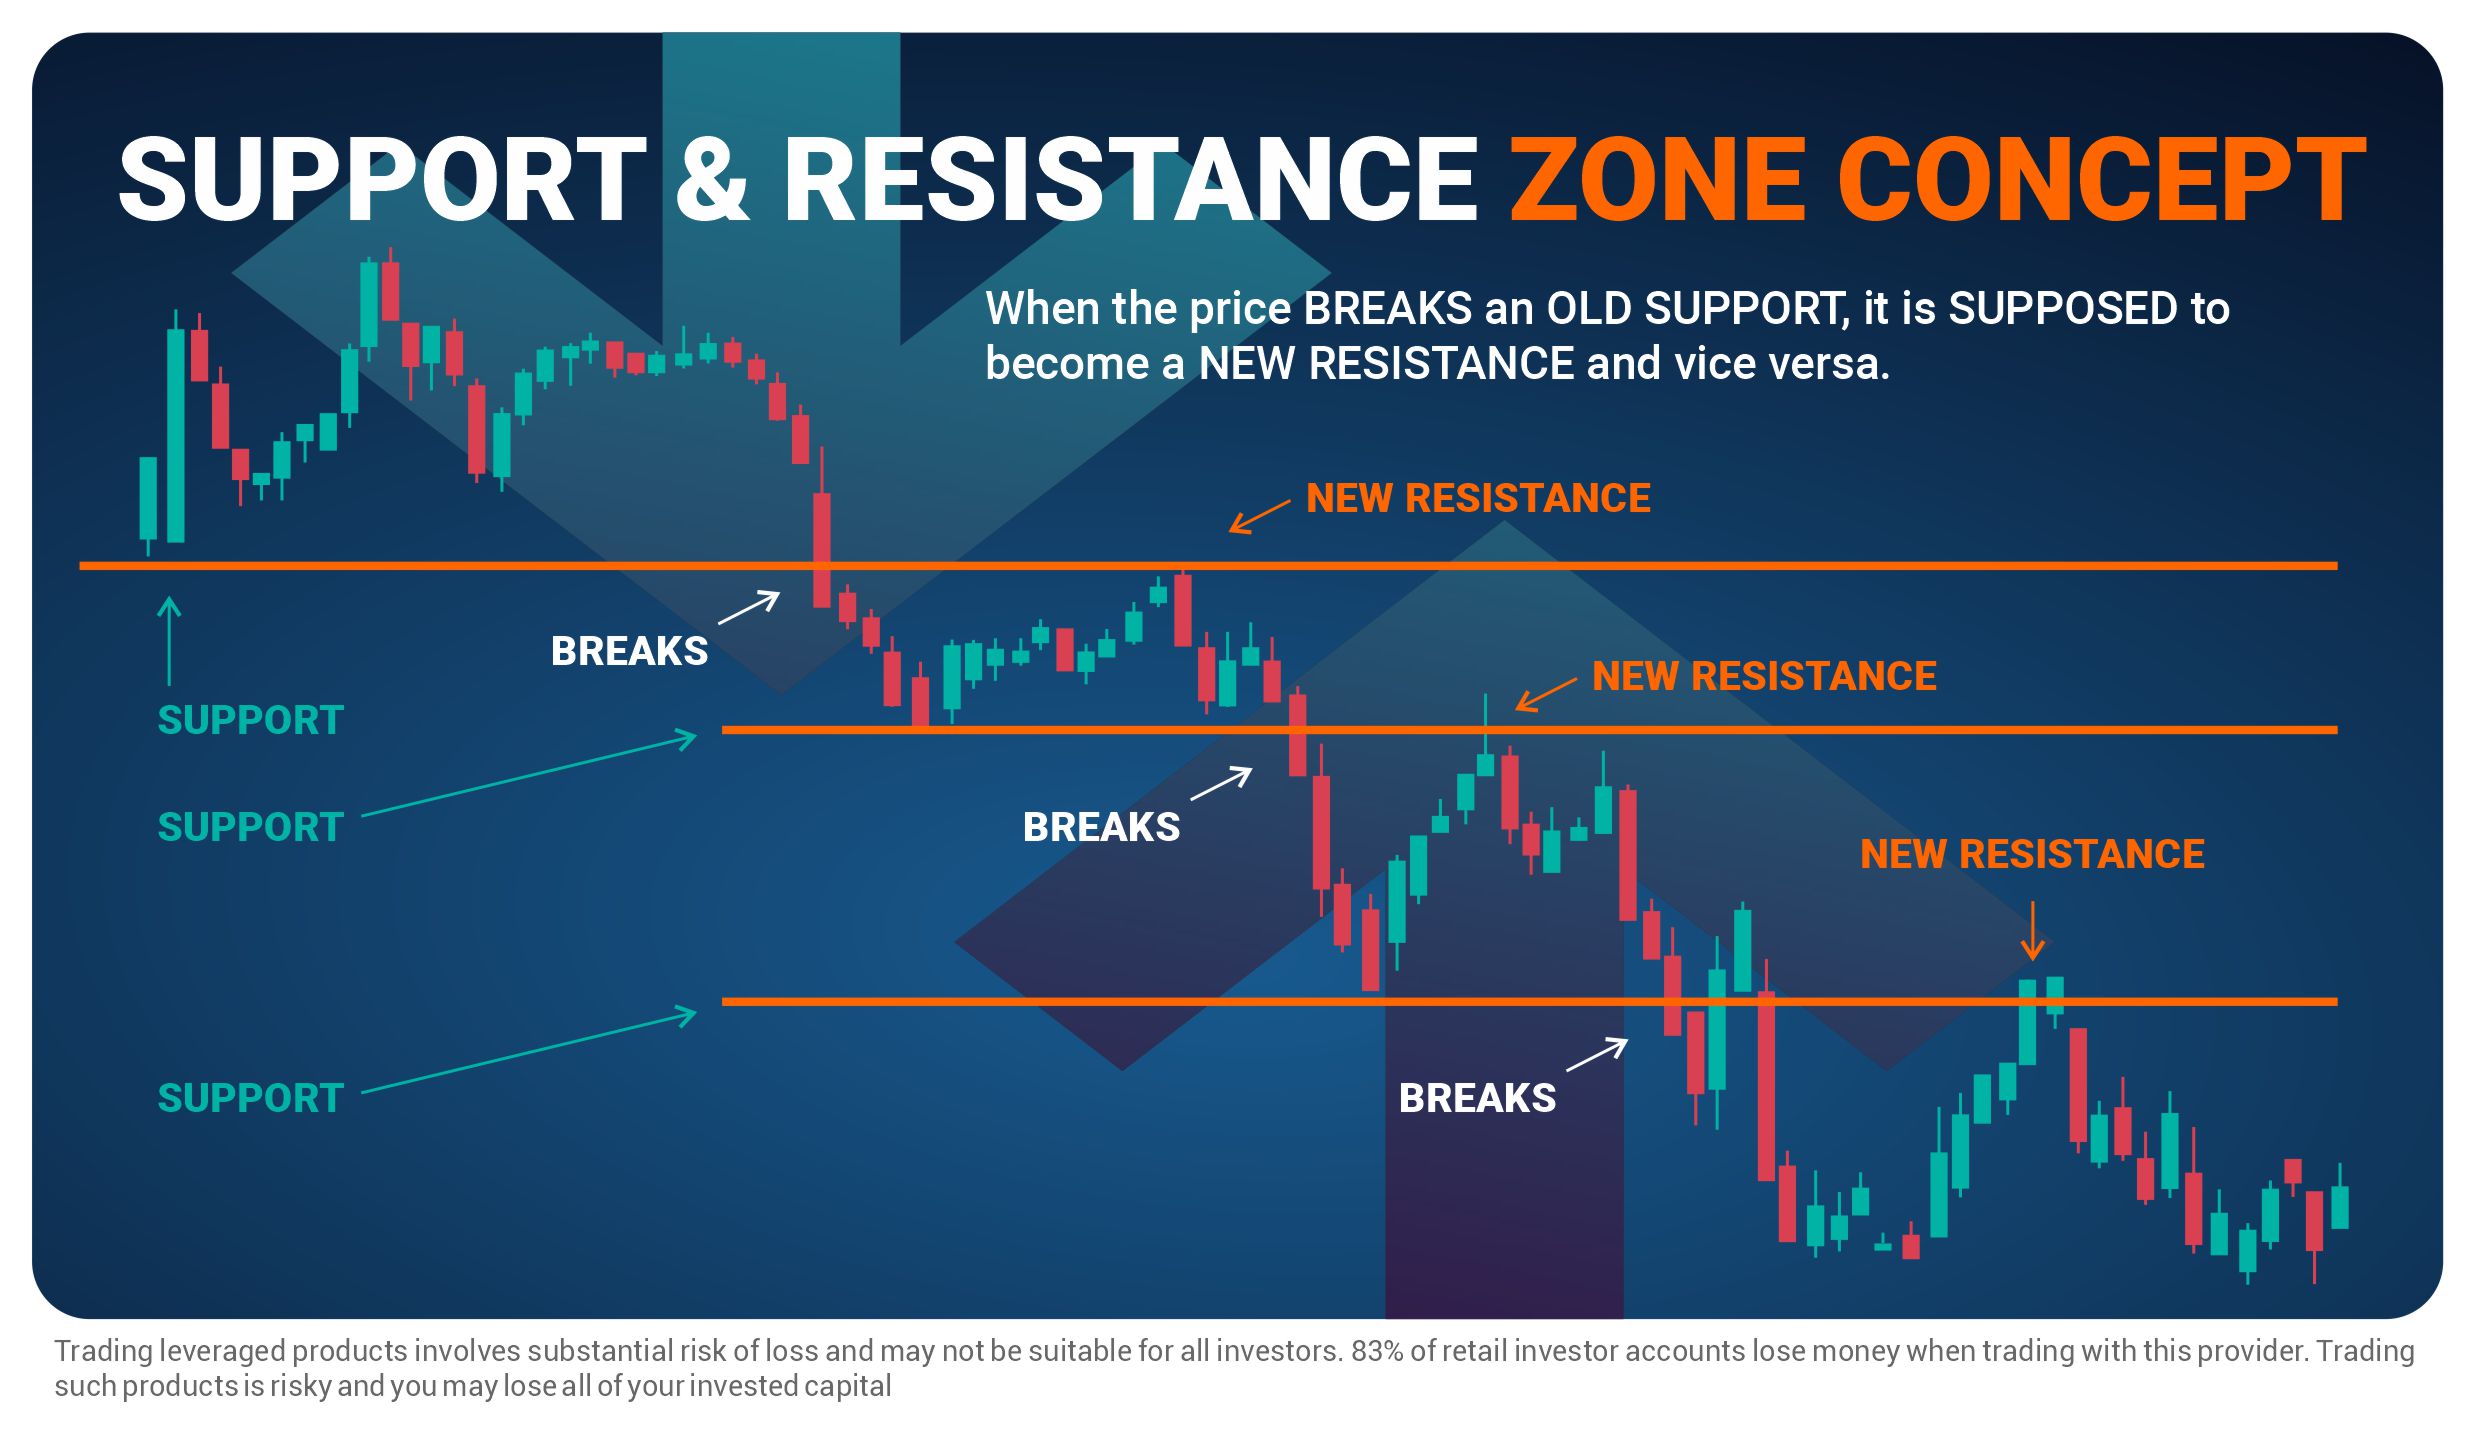
Support and resistance levels are key concepts in technical analysis used by traders to identify potential price levels where an asset is likely to encounter buying or selling pressure. By understanding these levels, traders can make informed decisions about entry and exit points, manage risk, and identify potential trend reversals. In this article, we will delve into the intricacies of support and resistance, exploring their definitions, characteristics, and practical applications in trading.
Support refers to a price level at which buying pressure is expected to be sufficiently strong to prevent further decline in the asset’s price. It is commonly represented by a horizontal line that connects multiple lows on a price chart. Traders believe that when an asset’s price approaches a support level, there is a higher probability of a price bounce or a trend reversal.
Resistance, on the other hand, is a price level where selling pressure is anticipated to be strong enough to prevent the asset’s price from rising further. It is often represented by a horizontal line connecting multiple highs on a price chart. When an asset’s price approaches a resistance level, traders expect increased selling activity, potentially leading to a price reversal or consolidation.
Characteristics of Support and Resistance Levels:
-----Cryptonews AD----->>>Sign up for a Bybit account and claim exclusive rewards from the Bybit referral program! Plus, claim up to 6,045 USDT bonus at . https://www.bybit.com/invite?ref=PAR8BE
<<<-----Cryptonews AD-----
- Multiple Touches: Valid support and resistance levels are typically confirmed by multiple touches. The more times a price level is tested and holds, the stronger it is considered to be. These levels gain significance as they demonstrate market participants’ consistent behavior and reinforce the belief that buyers or sellers are active at those levels.
- Role Reversal: Once a support level is breached, it tends to become a resistance level, and vice versa. This phenomenon is known as role reversal. Traders often observe previous support levels that have been broken to determine potential future resistance levels and vice versa.
- Psychological Significance: Certain price levels, such as round numbers or significant historical levels, can have psychological significance in the market. These levels often attract increased attention from traders, leading to potential support or resistance areas.
Using Support and Resistance Levels in Trading:
- Entry and Exit Points: Traders use support and resistance levels to identify favorable entry and exit points for trades. Buying near a strong support level or selling near a robust resistance level allows traders to define their risk levels and set price targets more effectively.
- Stop Loss Placement: Support and resistance levels also aid in determining appropriate stop loss levels. Placing a stop loss slightly below a support level or above a resistance level helps protect against adverse price movements and minimizes potential losses.
- Trend Reversal Identification: Breakouts above a resistance level or breakdowns below a support level can indicate potential trend reversals. Traders watch for these breakouts or breakdowns to capture new trends early and adjust their trading strategies accordingly.
- Price Consolidation: Support and resistance levels can also signal periods of price consolidation or range-bound trading. During these phases, traders may choose to implement range-bound strategies, buying near support and selling near resistance until a clear breakout occurs.
Support and resistance levels play a vital role in technical analysis and are widely used by traders to make informed trading decisions. These levels provide valuable insights into market sentiment, potential buying or selling pressure, and trend reversals. By understanding the characteristics and practical applications of support and resistance levels, traders can enhance their trading strategies, manage risk more effectively, and improve their overall trading performance. Remember that support and resistance levels should be used in conjunction with other technical and fundamental analysis tools for comprehensive market analysis.


