
Crypto Trading Bots: The CCI + RSI Pullback Strategy Explained
In cryptocurrency trading, one of the biggest challenges is identifying whether a price dip represents a healthy pullback within an uptrend or the beginning of a deeper bearish move.
Many profitable algorithmic trading systems address this problem by combining two well-known momentum indicators: the Commodity Channel Index (CCI) and the Relative Strength Index (RSI).
When used correctly, this combination can help traders and crypto trading bots identify high-probability pullback opportunities while filtering out many false oversold signals.
Why Pullback Entries Matter
Many inexperienced traders attempt to buy breakouts after a strong price rally. While breakout strategies can be effective, they often result in entering after much of the move has already occurred.


Professional traders and sophisticated crypto bots often prefer pullback entries because they offer:
Better risk-to-reward ratios
Tighter stop-loss placement
Lower emotional pressure
Improved long-term consistency
Earlier entry into emerging trends
The challenge is determining when a temporary decline is simply a pullback rather than the start of a major trend reversal.
Understanding the CCI + RSI Combination
The two indicators complement each other remarkably well, balancing speed and confirmation.
RSI (Relative Strength Index)
RSI measures the speed and strength of price movements on a scale from 0 to 100.
RSI above 70 suggests overbought conditions.
RSI below 30 suggests oversold conditions.
RSI between 40 and 50 often signals temporary weakness during an established uptrend.
CCI (Commodity Channel Index)
CCI measures how far price has deviated from its statistical average.
CCI above +100 indicates strong bullish momentum.
CCI below -100 indicates strong bearish momentum.
CCI below -200 often signals extreme selling pressure.
Unlike RSI, CCI tends to react faster to short-term price extremes, making it useful for detecting pullbacks before momentum fully recovers.
Why Oversold Alone Is Not Enough
One of the most common mistakes traders make is buying simply because RSI or CCI enters “oversold” territory. In strong downtrends, both indicators can remain oversold for extended periods while prices continue falling.
Successful trading systems rarely buy just because an asset is oversold. Instead, they wait for evidence that selling pressure is weakening and momentum is beginning to recover. This is where the CCI + RSI recovery pattern becomes a powerful tool.
The High-Probability Pullback Setup & Risk Management
A common pullback filter used by many algorithmic trading strategies looks for the following conditions. While this setup can work on various timeframes, algorithmic bots typically see the highest reliability on the 1-Hour (1H), 4-Hour (4H), and Daily charts to filter out intraday market noise.
The Entry Checklist:
Trend Filter: Price remains above the long-term trend (SMA200 or EMA200).
RSI Condition: RSI drops below 45, but is now rising.
CCI Condition: CCI drops below -100, but is now rising.
Volume: Volume begins to stabilize or increase on green candles.
Risk Management Setup:
Stop-Loss (SL): Placed strictly below the recent swing low of the pullback, or using a 1.5x ATR (Average True Range) buffer to avoid being wicked out.
Take-Profit (TP): Scaled out at the previous swing high, aiming for a minimum 1:2 Risk/Reward ratio.
The goal is not to buy maximum fear. The goal is to buy when fear is fading and buyers are starting to regain control.
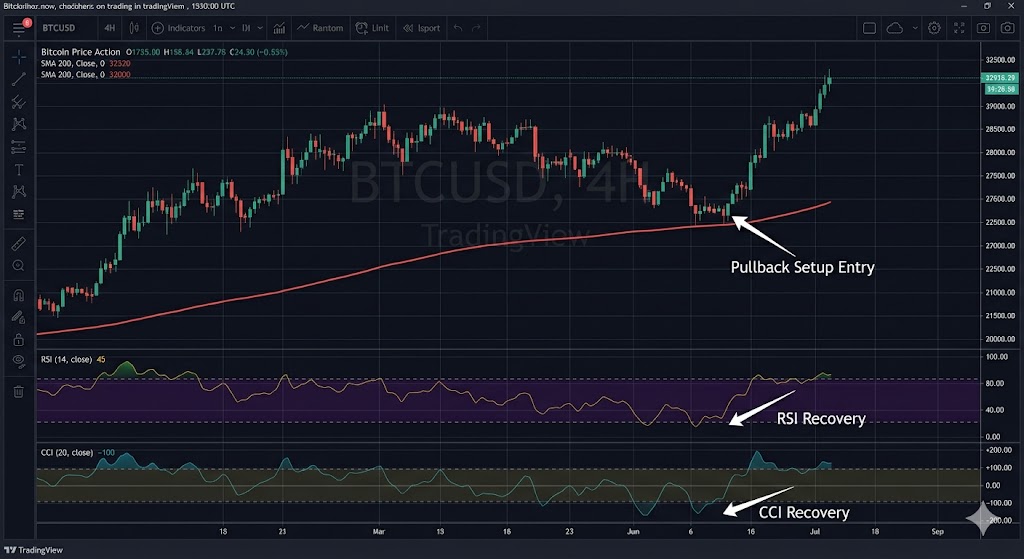
Example of a Strong Pullback Signal
Market Conditions:
RSI: 38 → 41 (Recovering)
CCI: -168 → -122 (Recovering sharply)
Price: Trading safely above SMA200
Volume: Above the 20-period moving average
MACD Histogram: Showing light pink/improving bars
Interpretation: The asset remains inside a larger bullish structure while both RSI and CCI show that bearish momentum is weakening. The recovery in both indicators suggests that the pullback may be ending and that a new bullish impulse could be developing. This specific setup often yields win rates significantly higher than a simple oversold reading when backtested across major crypto assets.
Additional Filters Used by Professional Trading Bots
Most advanced crypto trading bots do not rely solely on RSI and CCI. To improve accuracy and win rates, they often combine the setup with additional confirmation factors such as:
Positive MACD Histogram
Rising On-Balance Volume (OBV)
Positive Klinger Oscillator flow
Favorable Bid/Ask ratio and Order Book analysis
Multi-timeframe trend alignment
These extra layers help reduce the number of trades taken during weak or highly volatile market conditions.
🚀 Real-World Application: Automating the Strategy
Monitoring these conditions manually across dozens of crypto assets 24/7 is impossible for a human trader.
One powerful example of this approach applied automatically can be found at NeuralTrade.eu. As an AI-powered crypto trading system, NeuralTrade combines multiple technical indicators, volume analysis, order-book data, and machine-learning models to identify these exact high-probability pullback opportunities.
Within the system, the CCI + RSI recovery pattern acts as an early warning signal, while additional layers of risk-management determine whether the setup has sufficient confirmation to justify a trade. This multi-layer approach helps avoid the false signals that plague single-indicator strategies.
Final Thoughts
The CCI + RSI pullback strategy is much more than a simple oversold setup. Its real strength comes from identifying momentum recovery rather than merely detecting temporary weakness.
When combined with trend confirmation (SMA200), solid risk management, and multi-timeframe analysis, it becomes one of the most effective tools for spotting entries in volatile cryptocurrency markets.
While no indicator is perfect, traders and bots that focus on recovery signals consistently outperform those who blindly buy oversold conditions.
Disclaimer: This article is for educational purposes only and should not be considered financial advice. Cryptocurrency trading involves substantial risk, and past performance does not guarantee future results. Always conduct your own research and use proper risk management before making any investment decisions.
More Crypto News
Check our Market Overview
Disclaimer: This article is for informational purposes only and does not constitute financial advice. Always conduct your own research (DYOR).


